Who doesn’t like to browse SaaS companies for sale? Some listings provide no data while others give us just enough information to analyze the performance of the company.
Given enough information in the listing, we can extract double the amount of data, metrics, and insight from the publicly available data in the listing.
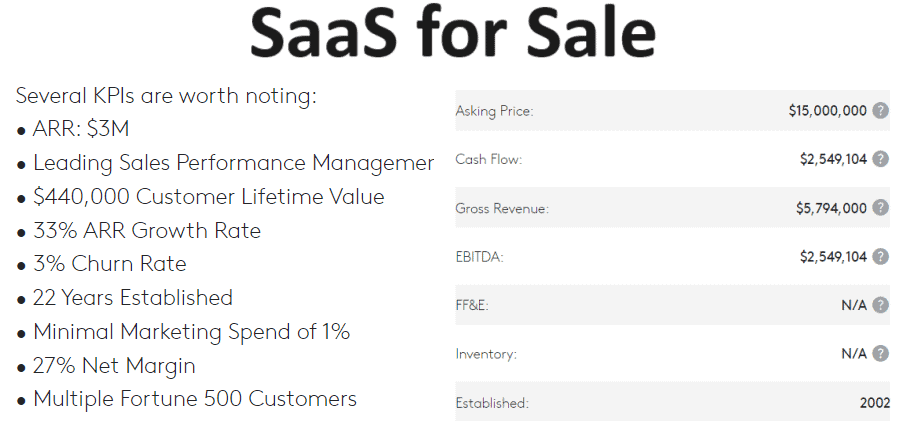
In the example below, let’s see what we can do with eleven data points. It’s a bit surprising how many SaaS metrics and data points that you can extrapolate.
But that’s the power of SaaS metrics. Start pulling the financial thread and a lot of data tumbles out. Let’s walk through this data step-by-step. My template with calculations is available for download below.
SaaS for Sale
Here’s the data that we have to work with. It’s a nice amount of data made publicly available in this listing.
Let’s walk through the data step-by-step to see what metrics we can back into.
Valuation Multiple
We are given the listing price for this SaaS company, and it’s revenue and ARR. We can calculate valuation multiples based on total revenue and ARR.
Computed:
- revenue multiple 2.6x
- ARR multiple 5x
Revenue
We are given total revenue, ARR, and growth rate which is really nice. It’s always good to understand how much revenue is in the “other” bucket. Great question for due diligence.
We were given headcount, so we can establish some org productivity calculations.
Given:
- $5.8M total revenue
- ARR $3M
Computed:
- Other revenue = $2.8M
- Prior Year ARR = $2.3M
- Revenue per FTE = $145K
- ARR per FTE = $75K
- Other revenue mix = 48%
Gross Margins
We are given the EBITDA number, and a “net margin percentage.” Now, “net” can mean a lot of different things. Another open question. In this case, I’m assuming it means Net Income.
Given:
- 27% net margin
- EBITDA $2.6M
Computed:
- EBITDA % = 44%
- Net income = $1.6M
Revenue Retention
Stated retention numbers always catch my attention. In this listing, we do not know if the churn and retention are annual numbers or monthly. Great question for due diligence.
We also don’t know the time period. Why does that matter? I like to calculate retention on a trailing basis. Say, T3M and T6M over the last 36 months. I’ll also calculate TTM retention if the SaaS company has a higher ACV product.
Net revenue retention was not mentioned in this listing. If it’s a solid number, mentioning it would also grab my attention. We could back into NRR but that’s for another time.
Given:
- 3% churn (assuming annual)
- 97% retention (assuming gross revenue retention)
Lifetime Value (LTV)
We are given a standalone LTV number. Now, we know from my SaaS metrics course that LTV by itself may be interesting, but it provides no context. We must compare LTV to CAC for context.
We also do know if this LTV number is gross-margin adjusted. GM adjusting your LTV is standard practice.
I was able to extrapolate new win ACV, because the listing provided a churn number.
Given:
- LTV = $440K
Computed:
- New win ACV = $13.2K
Bookings
I’m taking a bit of an assumption leap here. We know growth rate, so I backed into prior year ARR revenue and the ARR change year-over year.
Based on benchmark data from Benchmarkit.ai, I assumed a 70/30 split on the total ARR growth. 70% sourced from new business, and 30% sources from existing business.
I can then calculate the number of annua logo wins, because we have new ARR and the new win ACV from above.
Computed:
- New ARR = $521K (assuming 70/30 new/expansion split)
- Expansion ARR = $223K
- New logo wins = 39
Rule of 40
We know the EBITDA % and growth rate, so this one is easy. However, at this revenue stage, I do calculate Rule of 40 as another data point for context, but I don’t put too much emphasis on it yet.
Computed:
- Rule of 40 = 77
Leaps of Faith on the Data and Assumptions
Okay, here I may be stretching it a bit. We have to make assumptions on previous calculations driven by assumptions.
But it demonstrates how SaaS financial and operational data are linked together.
Marketing Spend
It’s stated that marketing is 1% of revenue. However, nothing is mentioned about Sales expense.
Computed:
- Marketing expense = $58K
Customer Acquisition Cost (CAC)
Okay, here I’m taking some leaps. Above, we computed new logo wins based an implied new win ACV and a big assumption on new vs. existing growth. But we can calculate CAC with what we have.
Again, we don’t know if there is a sales team which would materially impact this CAC calculation. We now have LTV to CAC. However, it’s a very funky, high number.
Computed:
- CAC = $1,468
COGS vs. OpEx Spend
Based on the margin profile mentioned in this listing, I’m going to assume that it has great overall gross profit margins. I’m going to assume 85% which is high.
But with that assumption, we can back into COGS expense.
We also have net income and total revenue, so we can also calculate OpEx spend. Again, this relying on big assumptions.
Computed:
- COGS = $869K
- OpEx = $3,360K
People Spend
From my experience working with a lot of SaaS companies, we see People spend from 60-80% of total expense. I’ll assume 70% here. We can back into People spend and average spend per FTE.
Computed:
- People spend = $2,960K
- People spend per FTE = $74K
Total Customer Count
We calculated new ACV and we have total ARR. We can compute total customer count. Here, I’m about to jump off the assumption ledge, but let’s run with it.
Why this total customer count would be wrong? Pricing changes over time. Pricing changes deal to deal. This calculation is spotty but doable.
Computed:
- Total customers = 227
The Power of SaaS Metrics
For the experienced SaaS metrics operator, you can do a lot with a little. This demonstration shows you how SaaS metrics and data are connected to each other.
SaaS metrics are the language of SaaS. If you’d like to level up your SaaS metrics knowledge, check out these courses.
What would I like to see in a listing? This is enough to grab my attention.
- Total Revenue
- Total ARR
- Growth %
- EBITDA %
- GRR / NRR
- Total staff including contractors
- Maybe, something on S&M efficiency
The Demo Company
I don’t know this SaaS company (public data and listing), but I’d love to help them get more eyeballs on their upcoming exit. Let me know in the comments and I’ll send the posting link.
Disclaimer: these are my best estimates at calculations. Your experience may vary.
Download the Template
I have worked in finance and accounting for 25+ years. I’ve been a SaaS CFO for 8+ years and began my career in the FP&A function. I hold an active Tennessee CPA license and earned my undergraduate degree from the University of Colorado at Boulder and MBA from the University of Iowa. I offer coaching, fractional CFO services, and SaaS finance courses.