
First Half 2022, NBER Edition
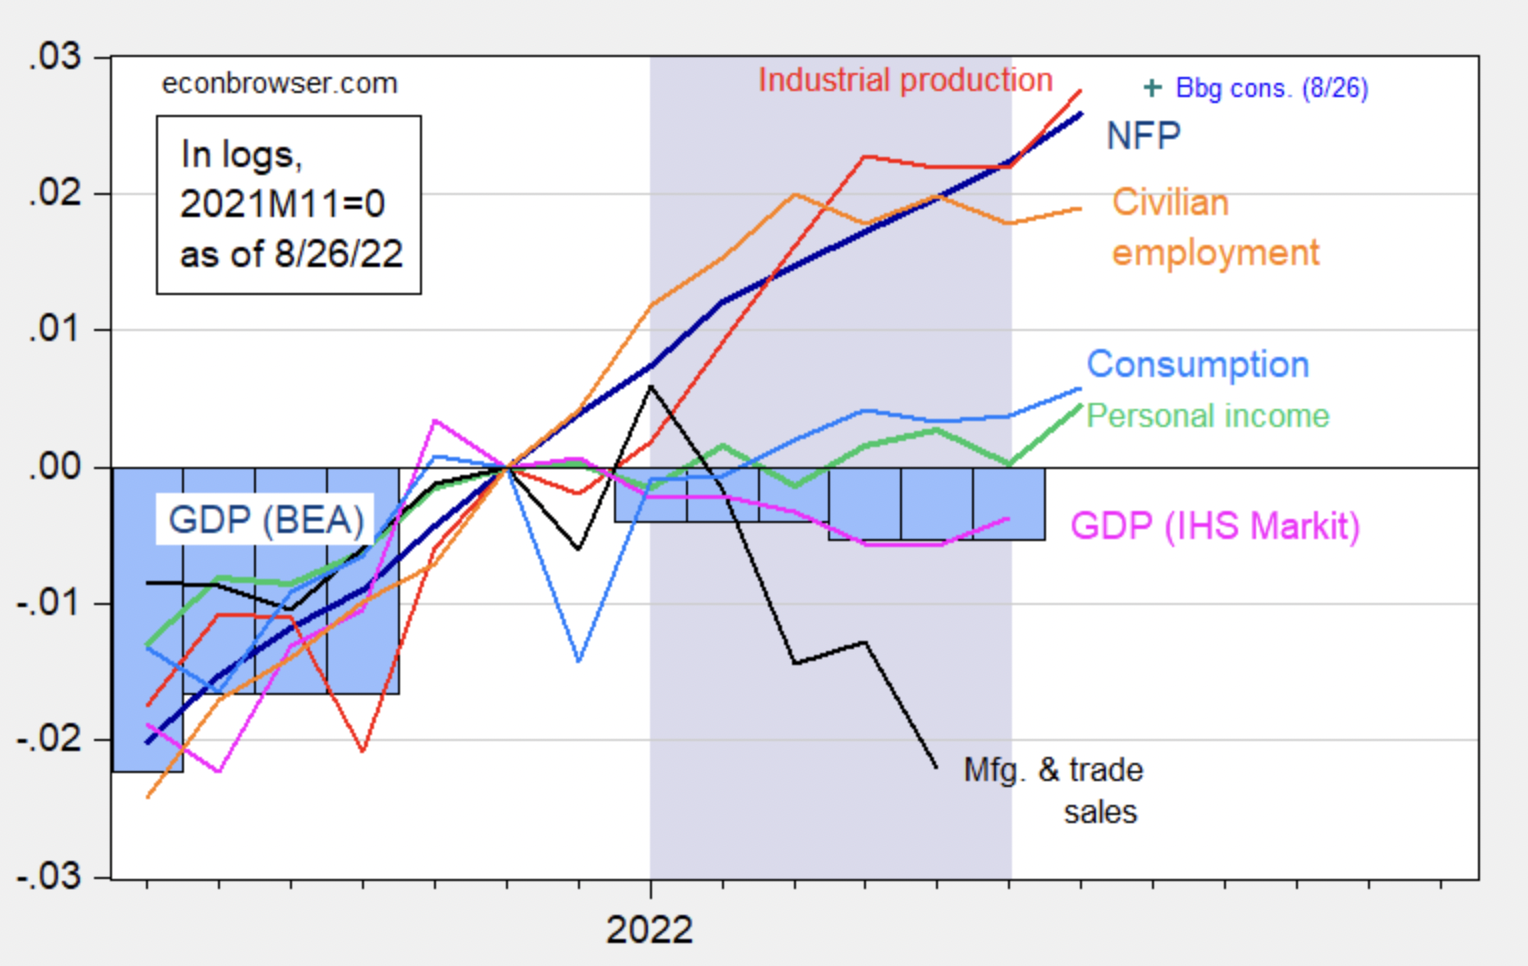
The debate between the official NBER determination of a recession and the 2Qs approach has been endlessly discussed. Rather than spill more pixels on this, I will instead direct you to the Menzie Chin chart above (hat tip Invictus).
You can see why the NBER does not rely on GDP (pink line) alone; GDP was slightly negative, while Manufacturing and Trade Sales were more negative. But then NFP was very strong, as was Industrial production, Civilian employment, Consumption, and Personal income.
It is difficult to look at these 6 (or 7) data points honestly and draw the conclusion that the nation’s economic activity in the first half shrunk. You can track all of these data points on FRED, as explained by this blog post.
This is the reason why a $20 trillion, complex global economy with so many different moving parts cannot rely on an oversimplified and dumbed down definition1 — like two consecutive quarters of negative GDP.
See also:
The data and determinations behind dating business cycle peaks and troughs
The FRED Blog, August 29, 2022
The “recession…of H1 2022”? (Part II)
by Menzie Chinn
Econbrowser August 26, 2022
Previously:
Why Recessions Matter to Investors (July 11, 2022)
Soft Landing RIP (July 25, 2022)
The Uncertainty Monster (July 21, 2022)
Lessons From the Future (August 24, 2022)
____________
1. Of course, some people insist on using this definition. Some are partisan hacks, others just don’t know. For those of us who put capital at risk making probabilistic decisions about an inherently unknowable future, we want something less crude than that -2Qs.
