
By David Enna, Tipswatch.com
One of the very first Treasury Inflation-Protected Securities I ever bought — CUSIP 912810FH6 — was auctioned on April 7, 1999, with a real yield to maturity of 3.899% and a coupon rate of 3.875%. I still own that little gem, which has racked up an inflation index of 1.85668 on its way to a maturity date of April 15, 2029.
As great as that investment was, it spoiled me. Real yields didn’t hang near 4.0% for long. Soon we were seeing 2.7%, then 2.5% then 2.0%. Those were still great real yields, but not my highly coveted 3.899%. So I lost interest in TIPS for awhile.
Now, after more than a decade of very low and even negative real yields on TIPS, we are again back to a 2.0% real yield across nearly the entire TIPS maturity spectrum. I’ve been investing aggressively at these yields, but there is always the question: Are we arriving at a “new normal”? Here is where we stand today:

Does this look normal? I’d say “not at all,” because this yield curve is extremely flat. In normal times, you’d expect longer-term yields to be higher than shorter-term yields. To get to normal, either the longer-end needs to rise or the shorter end needs to fall.
But then, what is “normal”? I don’t know the answer; I wish I did. Can recent history tell us? I looked back through real yield information compiled by the Federal Reserve Bank of St. Louis, with daily real yield estimates dating back to 2003 for the 5- and 10-year TIPS; 2004 for the 20-year; and 2010 for the 30-year.
Can charts tell the story?
In each of the following charts you will note the spike higher in real yields during the financial crisis of late 2008 and then again in the pandemic distress of March 2020. In both those cases, panicked investors were selling everything. Yields returned to more typical levels relatively quickly.
But after each of those market panics, the Federal Reserve reacted with aggressive quantitative easing (bond buying that pushed yields down) and slashes to short-term interest rates, resulting in a near 0.0% return on safe investments.
So the case can be made that the entire period from 2008 to 2022 was not normal, subject to aggressive market manipulation by the Federal Reserve. That era ended in March 2022, when the Fed abandoned quantitative easing and began raising short-term interest rates, first slowly and then aggressively.
Here are the charts:

During the 2022 to 2023 cycle of Federal Reserve tightening, the 5-year real yield has been the quickest to respond to short-term rate increases and has been lingering around 2.0% since early July 2023. But as you can see in the chart, the 5-year has rarely broken through the 2.0% real-yield barrier at other times back to 2003.
My guess: The “normal” real yield of a 5-year TIPS appears to be in the range of 1.25% to 2.0%.
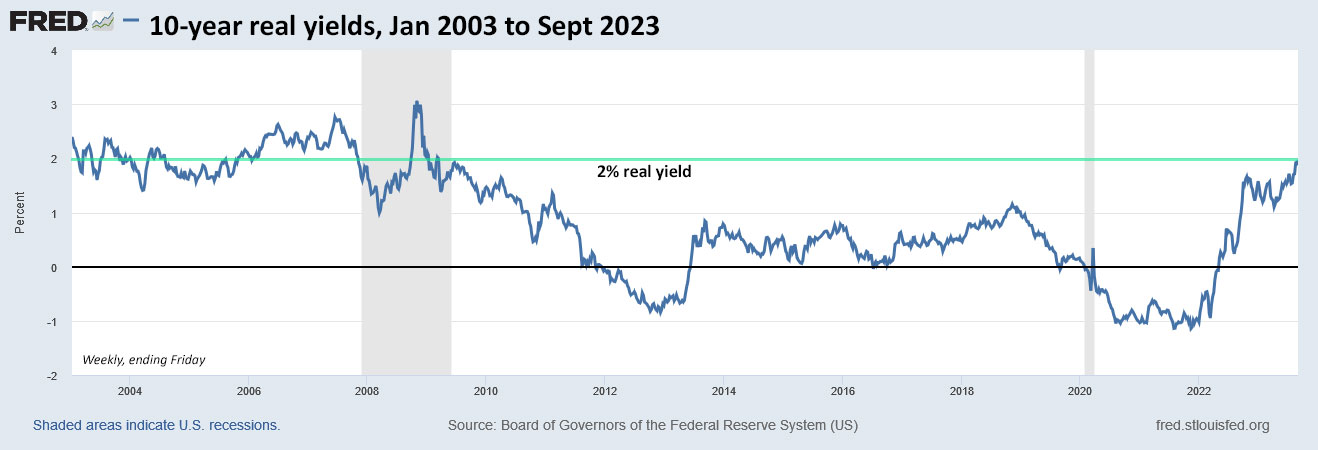
Surprisingly, 10-year real yields have been slow to creep up to the 2.0% level, but on Wednesday the most recent issue of this term was trading at 2.0% on the secondary market. Note that a real yield around 2.0% was common for the 10-year before the financial crisis of 2008.
My guess: A “normal” 10-year real yield appears to be in a range of 1.5% to 2.2%.

FRED’s tracking of the 20-year real yield dates back to 2004. Note that in the four years before the 2008 financial crisis, the 20-year real yield ran very close to — or well above — the 2.0% barrier.
My guess: It’s possible that 1.8% to 2.2% could be a baseline “normal” real yield for a 20-year TIPS.

FRED’s records for 30-year TIPS only go back to 2010 — two years after the turmoil of the financial crisis — so it’s hard to draw any conclusions. The Treasury did not issue 30-year TIPS from October 2001 tot February 2010. I consider the early years of these long-term TIPS, from 1998 to 2001, to be unreliable as a gauge for a “normal” 30-year real yield. Over that time, auctioned real yields ranged from 3.4% to 4.1%. I don’t think we are returning to those “glory days.”
My guess: I’d think that 2.0% to 2.25% could a baseline normal yield for a 30-year TIPS.
Can the U.S. economy handle this?
It has been surprising to see the U.S. economy continue to hum along even as short- and long-term interest rates have increased 300 to 500 basis points. No one seemed to expect this; the recession was supposed to start months ago. But because it hasn’t, the Federal Reserve has kept up the fight against inflation.
Bloomberg this week posted an article theorizing that the surge in U.S. interest rates could hamper the U.S. economy for at least a decade. From the article:
Central bank interest-rate increases reduce potential economic output for at least 12 years, in contrast to traditional theories of national economies that assume policy is neutral in the long run, Federal Reserve Bank of San Francisco research found. … For example, in response to a 1% interest-rate increase, real gross domestic product would be about 5% lower after 12 years than it would otherwise be, the researchers found.
In other words, the U.S. economy will feel pain as interest rates rise after years of near-zero yields on safe investments. But those yields were artificially created through Fed manipulation. The yields we are seeing in September 2023 are rising to historically valid levels, with almost no Fed manipulation on mid- to longer-term Treasurys.
The long view
The St. Louis Fed does track nominal 10-year yields all the way back to 1963, so you can get a better idea of the massive fluctuations in yields over the last 60 years, a period that included an intense battle against raging inflation that lasted into the early 1980s. Here is the chart:
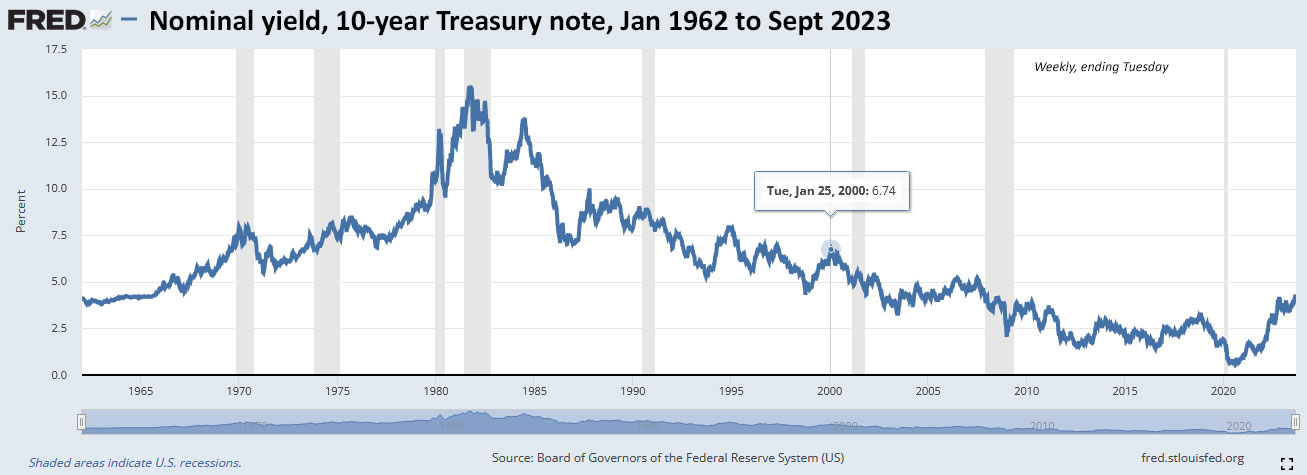
I highlighted the 6.74% yield in January 2000, which marked the last period the nominal 10-year was yielding more than 6%. On Jan. 12, 2000, a 10-year TIPS auctioned with a real yield of 4.338%. Oh, and by the way, the U.S. inflation rate in January 2000 was 2.7%.
I note this because I’ve seen recent commentary (such as this from Bloomberg) suggesting that the the 10-year note could be heading to 6%. For example:
That’s an eye-popping figure. And Kaminski acknowledged that we’re coming off a “decade of really low interest rates.” But we’ve seen 6% rates before, she said, “so it’s not strange to think that we may have higher rates if we have surprises to the upside in inflation later in the fall.”
Final thoughts
The point is: It’s a new, uncertain era.
We are normalizing, but at this point we don’t know what the “new normal” is. How high can real yields go? Will we overshoot to the high side? And, can it last?
Do I know? Of course not. But it is clear that today’s real yields of 2.0% above inflation are historically attractive.
• Now is an ideal time to build a TIPS ladder
• Confused by TIPS? Read my Q&A on TIPS
• TIPS in depth: Understand the language
• TIPS on the secondary market: Things to consider
• Upcoming schedule of TIPS auctions
* * *
Feel free to post comments or questions below. If it is your first-ever comment, it will have to wait for moderation. After that, your comments will automatically appear. Please stay on topic and avoid political tirades.
David Enna is a financial journalist, not a financial adviser. He is not selling or profiting from any investment discussed. I Bonds and TIPS are not “get rich” investments; they are best used for capital preservation and inflation protection. They can be purchased through the Treasury or other providers without fees, commissions or carrying charges. Please do your own research before investing.

Another great macro-perspective on rates, thanks so much David! I’m in the camp that inflation stays high because of continuing supply chain problems due to labor shortages and irresponsible fiscal policy. So TIPS seems like a sound investment now, considering the very uncertain future upon us, and a return to normal as you beautifully illustrated in those charts. A whole cohort of younger generations have come of age in this era of low rates, so their perspective of value and cost is distorted, and therefore they’ll continue to spend, even if they’re broke because they’ve always been bailed out, and that will continue to prop up our economy (consider that consumer credit is breaking records right now, but the economy is humming along like you said). Quit rates are still high too (I just saw a job posting the other day where a requirement was to have held employment somewhere for at least one year), so that was telling about the labor issues companies face. The Fed can’t manage the economy alone; they need help from policymakers, and they continue to show dysfunctional behavior. We’ll see that on display again later this month with a possible shutdown being debated. I’m with Katy Kaminski in that we’ll see the 10-Yr go over 6%. Start locking in those longer term yields now before the curve normalizes again soon!
Vanguard’s 10 year market outlook (8/17/2023)
https://advisors.vanguard.com/insights/article/series/market-perspectives#projected-returns
Tips are 3-4%, and inflation is projected to be 1.9-2.9%, suggesting a real return of 0.1- 2.1%. So according to vanguard’s projections real 2.1% would be the upper limit so 2.0% is a good time to buy.
Interestingly nominal treasuries are 3.6-4.6%, giving real return ranges of 0.7-2.7%.
Us equities 3.7-5.7%, or 0.8-3.8%, so that 2% real guaranteed for tips fits in the midpoint of their projected us equity returns. Of course they might be wrong.
So, if we believe Vanguard we are better off in nominal treasuries than TIPS?
Ann, it could be a toss-up, depending on how you view the risk of future inflation. If inflation runs at 1.9% to 2.9%, then a TIPS with a real yield of 2.0% will get a nominal return of 3.9% to 4.9%. Vanguard is projecting nominal Treasurys with a return of 3.6% to 4.6%. So TIPS have a slight advantage, possibly.
What I can’t tell from the Vanguard forecast is if it’s an apples-to-apples comparison regarding the maturities of a basket of nominal treasuries versus a basket of TIPs. (FWIW, they do have a lower median volatility for TIPs vs nominals.) But in general, it’s probably not practical to parse this kind of forecast all that closely anyway.
I would say that it’s nice to see a forecast for nice yields on all kinds of bonds–I’d kind of forgotten what this was like!
Nominal yields usually have a rising curve, because as the maturity goes longer the risks rise. What kinds of risks? Well certainly credit risks and inflation -and forgoing other opportunities. For TIPS I am not worried about the credit risk; I don’t expect the U.S. Treasury to default on any of its obligations. Nor am I worried about inflation – after all, that is the whole point of TIPS. So I would expect the real yield curve to be significantly flatter for TIPS than for Treasuries with a nominal yield. Of course, there is still the opportunity cost, so the real yield curve need not be completely flat, but I certainly also expect it to look different from the nominal yield curve.
Good point!!
Excellent analysis…..thanks!!!…IF and WHEN 10 year nominal hits 5 or above, then we are really retired….will need to find a way to keep a lot of dry powder….in the interim, T-Bills and short-term maturity notes is my current plan-in-execution, one never knows. For TIPS, I will continue to buy at auction, for example, 5 Year TIPS every year, the way I have been buying I-Bonds for many years. This requires selling some ETFs or individual stocks, in any case, I need to do some balanching with heavy equity tilt in ourretirement accounts. The only difference from I-Bonds is that my TIPS are bought only in our IRA accounts. Only if I had seen this blog many years ago, however, I am only 67+ and at least 33 more to go if I can keep swimming about a mile every weekday….and it’s neverltoo late to start (my way of consoling myself :))….ideas on fine tuning my approach will be most appreciated and welcome….need to learn and feel more comfortable in picking good TIPS deals in the secondary market….yes, I need to learn faster……best…chander
Thanks for yet another informative post. Would you be willing to post the CUSIPS for the TIPS ladder you have built? It could make it easier for first-timers trying to buy on secondary market.
Back in January I posted the basic outline of my ladder, but it has expanded greatly since then … https://tipswatch.com/2023/01/08/tips-funds-vs-a-tips-ladder-an-investor-weighs-in/ … I readily admit my process was haphazard and I didn’t really get serious about this until this year, when real yields became attractive.
You can use this site: https://www.tipsladder.com/ to produce a very good outline of a ladder, and you can set the beginning and ending years and the amount of income you want to produce.
Robert Shiller presents real rates for indexed bonds since 1985 for four countries (Australia, UK, Chile, and the US [from 1999] on page 15 of the 3rd edition of Irrational Exuberance. It’s quite clear that real rates in all four countries are at much lower levels today than they were throughout most of that period. Elsewhere in his earlier work (if I can find it, I’ll post it), Shiller calculated US real rates for most of the 20th century based on short-term T-bills. My recollection, which may be flawed, is that they were substantially higher than today’s, but more notably, they fluctuated more dramatically than they do now.