Hello and welcome to Limelight, the future of FP&A. Limelight is a cloud-based solution where finance users like yourself can unify data, uncover insights, and gain more time for analysis through automation.
We know you’re busy so we’ve taken the core benefits of Limelight and put them in a brief demo so you can see how making the switch to Cloud FP&A can make your life easier and unlock new value for your organization.
Here’s what you can expect to see in 10 minutes.
In 1 Minute - See it All with Interactive Dashboards
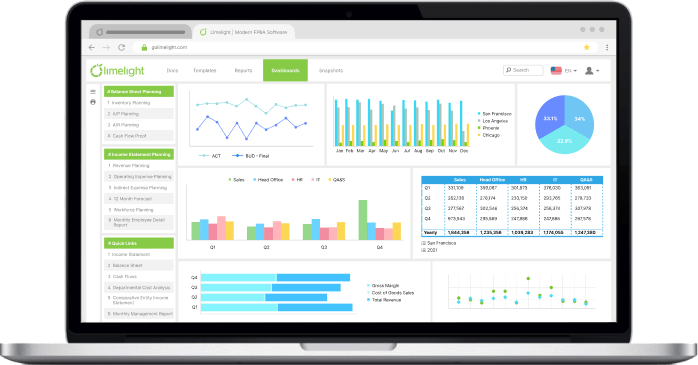
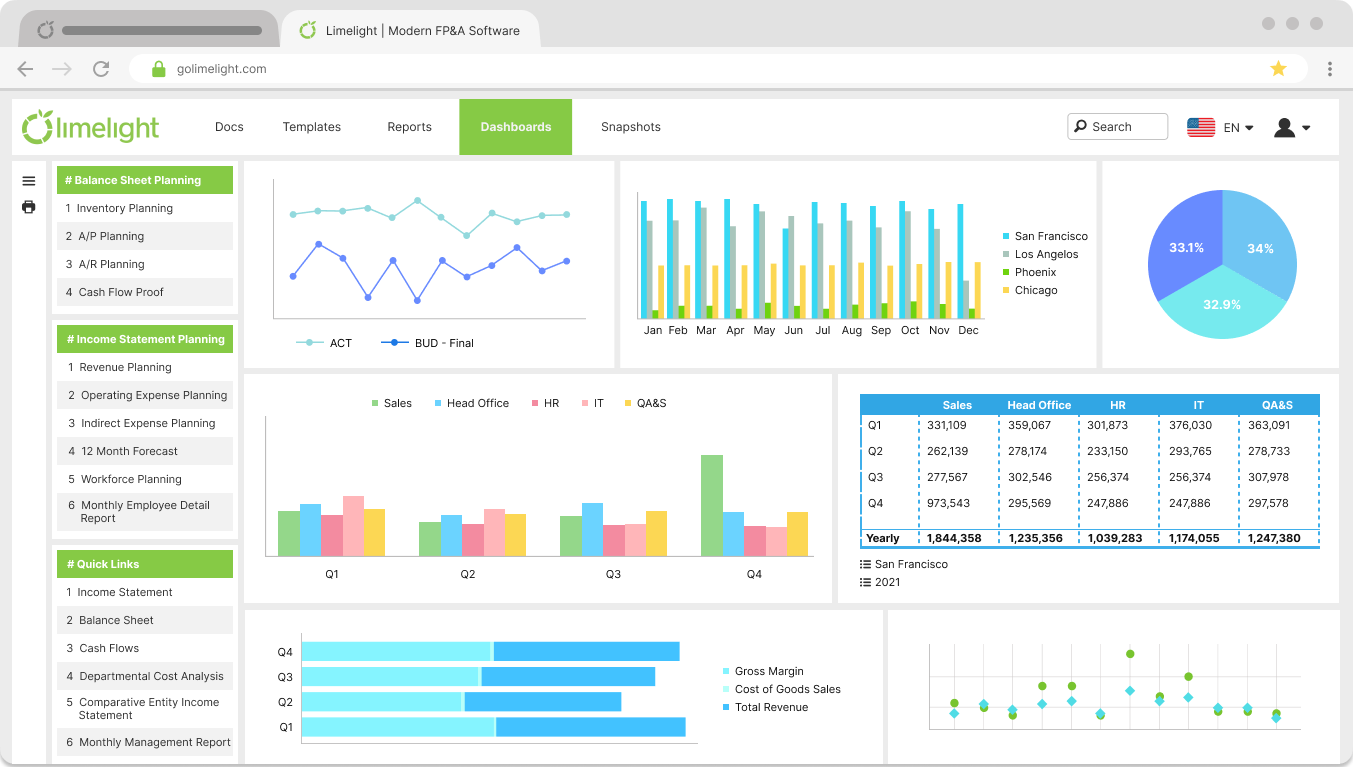
When you log into Limelight (from any device), you’ll be greeted by your custom-made dashboards. You’ll be looking at real-time data, giving you an accurate view of your organization's performance. No need to switch screens between your ERP, Excel spreadsheets, and accounting data as the information is displayed in one consolidated view. Think of dashboards as your single source of the truth.
This dashboard is configured to reflect whatever you choose like metrics, and KPIs straight from your ERP. Dive further into your numbers with interactive features like filters and drill-downs.
In 3 Minutes - Putting your Excel Skills to Work
As you make your way through Limelight, you notice we’ve kept the best bits of Excel. Limelight doesn’t just look like Excel, as it also supports Excel formulas and keyboard shortcuts so the underlying system is easy to learn and adopt. You don’t need to learn a new language; all you need are the skills you already have and creative financial thinking. Keep what you love about Excel, and leave the problems behind.
In 6 Minutes - Budgeting and Forecasting Beyond What Excel Offers
When you sit down to work, you’ll quickly see how Limelight transcends Excel with robust features such as line-item details, context filters, and audit trails. With line-item details, you can add sub-ledger details to any G/L account. This removes the headaches of adding rows, columns, or additional worksheets in Excel that don’t automatically connect and consolidate. 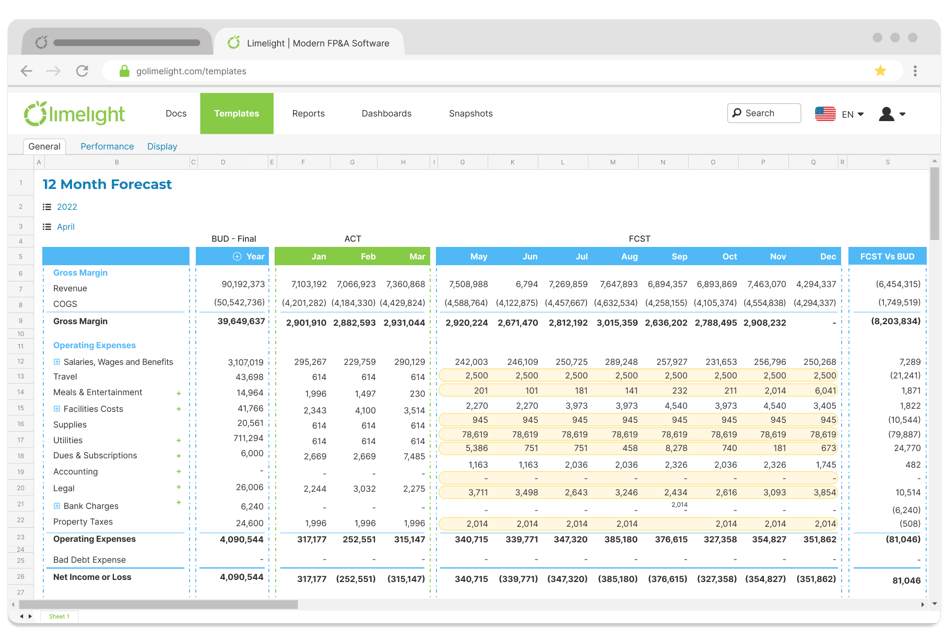
You don’t need to create multiple tabs or worksheets to support each department’s budget. With dynamic templates and context filters in Limelight, a single template is all you need. This saves finance teams time from constantly updating, copying & pasting, emailing, and manually consolidating different files for every department.
Limelight also has version tracking features to keep track of changes and variations made within reports. You can use audit trails to see what has changed recently, and how much has been changed along with screenshots of what has been added. Mistakes can easily be detected and corrected without digging through mountains of spreadsheets and versions.
In 7 Minutes - Expand Your Forecasting Horizon
Remember when consolidating data took up all your time and forecasting far into the future seemed like a fantasy? Well, with a few clicks in Limelight you can compare forecasts to updated actuals and automatically calculate variance – giving you insights to adjust for the rest of the year and beyond. Pivot in minutes with rolling forecasts. 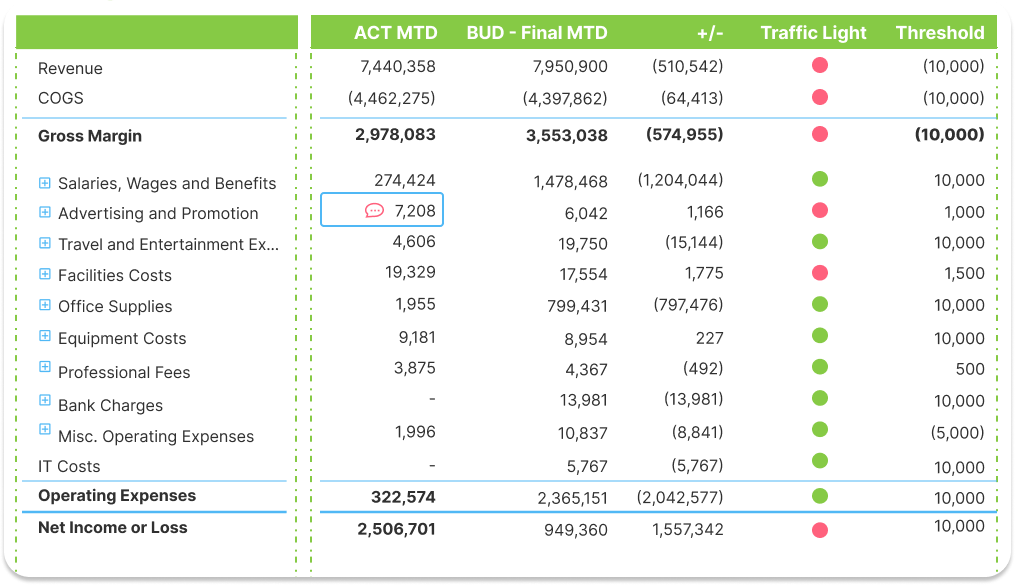
In 8 Minutes - Workforce Planning Made Easy
With an out-of-the-box workforce planning template, you can plan employee costs and more at an individual level without having to make any special configurations.
Tracking employee expenses is now easier than ever. All you need to do is add the employee’s information and the calculations are performed automatically. Adding new employees is also very easy. Department, location, and termination date (if the employee is working on a contract) are easily adjusted using the new employee entry form.
In 9 Minutes - Your Reports, Your Way
If you're looking for an intuitive reporting solution with lots of options, you're going to love Limelight. Limelight has all the features you need to create custom reports with powerful visualizations, narrative, collaboration, and presentation. You can create fully realized reports in minutes, not days.
You can compare one budget scenario against another as you move through the budget cycle. You can choose a filter like time or location and the contents of the report will update automatically.
In 10 Minutes - [New Features] Translate Numbers into Insights for Stakeholders
Some jaw-dropping recent additions to the Limelight package have been Limelight Docs and our PowerPoint integration.
Docs is where dynamic Limelight data meets narrative. You can take charts and graphs from their dashboards, write about the latest developments within your company and put custom-built reports into the document as well. All the information in the reports through the charts and graphs update automatically.
Likewise, Limelight for PowerPoint enables users to directly export Limelight data to their PowerPoint presentations to make presenting to managers and shareholders that much easier. 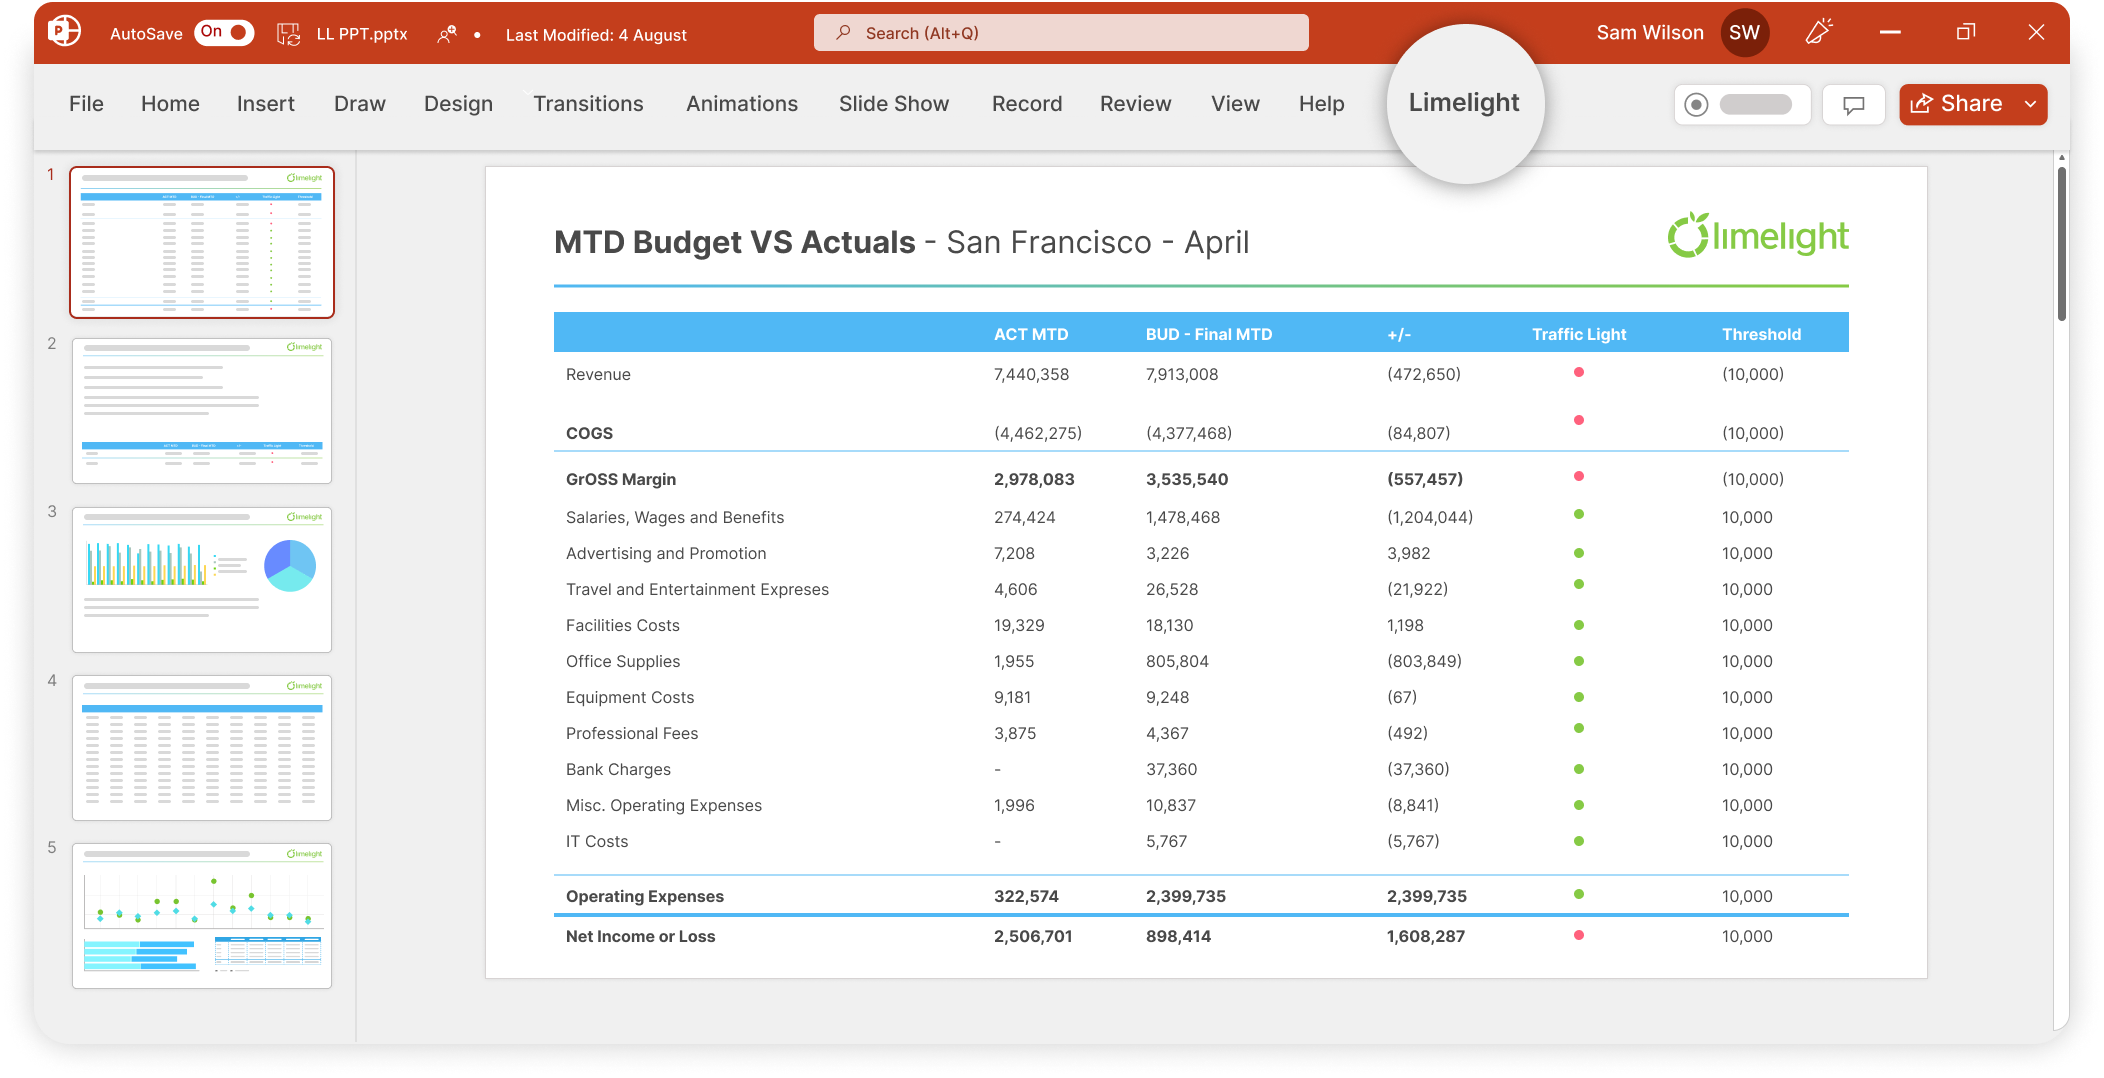 Ready to see it all in action? Click here to watch our 10-Minute Demo