
Everything You Wanted to Know about FP&A Best Practices
The finance function now plays a crucial role in many organizations supporting and driving effective business decisions, and this is exactly the responsibility of FP&A standing at the crossroads of finance, strategy and technology to leverage data and generate insights. Many finance and FP&A leaders are now facing transformational projects trying to find the future shape of the FP&A organization.
Being an emerging discipline within finance function, financial planning and analysis encompasses its own processes, tools, techniques and skills which should be optimized to meet constantly growing needs, requirements and responsibilities. Comparing performance metrics (qualitative and quantitative) against the peers and FP&A best practices can be very useful when assessing the current state of FP&A, creating a vision of the future state, finding the ways to enhance existing capabilities and identifying opportunities for improvement.
Benchmarking is an extremely powerful tool, but unfortunately, this kind of data, accumulated by consulting firms and professional associations conducting surveys and research on various adjacent topics, is not easily available or is highly fragmented.
We were bold enough to try and solve this problem by gathering and sharing in one article numerous findings and metrics published recently by various organizations. These benchmarks, represented in the form of the infographics below, concern main processes and tasks of the FP&A function, tools and techniques used to support these activities, current skills of the FP&A professionals and the greatest opportunities for skills development.

Sources:
1. APQC, AFP Next level of FP&A study, 2019
2. APQC’s Open Standards Benchmarking® Performance Assessment in Planning and Management Accounting
3. APQC’s Open Standards Benchmarking® Performance Assessment in Planning and Management Accounting
4. How Is Your FP&A Function Performing Compared With Your Competitors? CFO Innovation, Oct 12, 2016
5. How to Build a Business Case for Dynamic Financial Planning and Forecasting (Infographic), Sep 2014
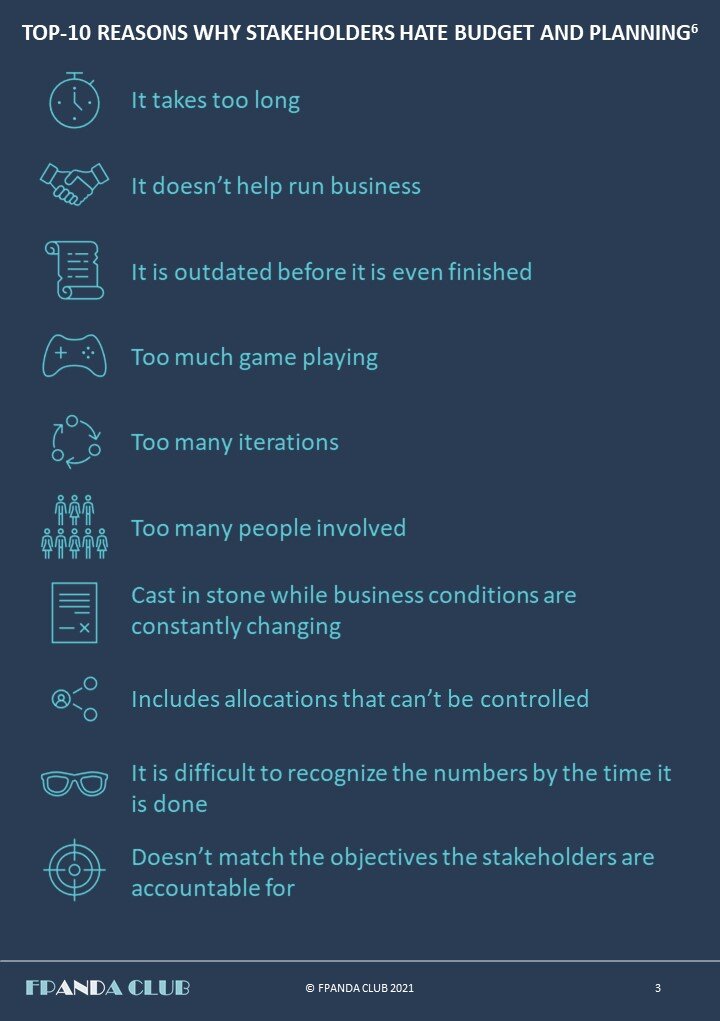
6. Best practice in the budget and planning process, PWC 2017
7. Memo to the CFO: Get in front of digital finance – or get left back, McKinsey & Company, July 2018
8. FP&A Survey: The technology and data platform supporting finance decisions, AFP 2020
9. Preparing for the next level of financial planning and analysis, APQC, AFP, 2019
Some of the most interesting metrics include:
Processes
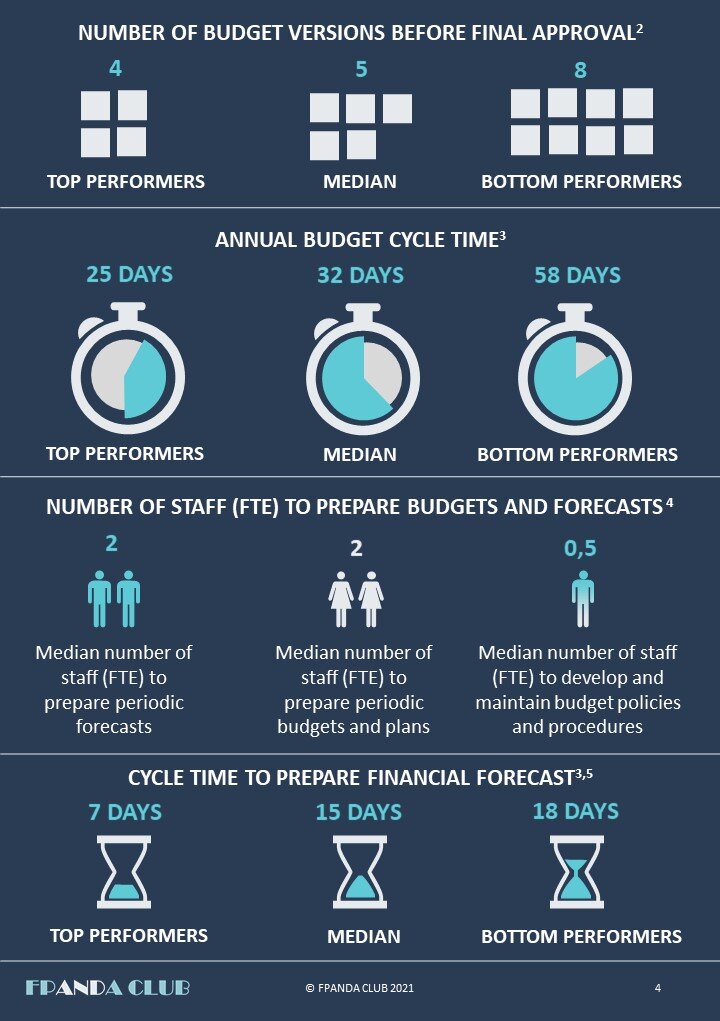
Annual budget cycle time lasts 25 days for top performers with 4 versions of budgets produced before final approval.
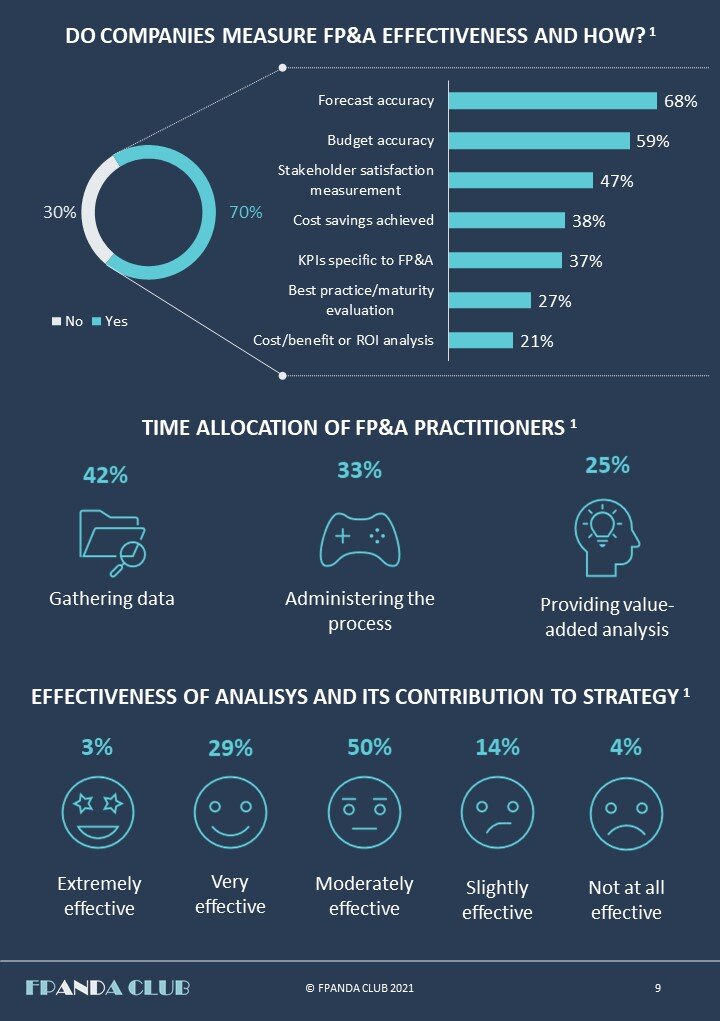
70% of companies measure the efficiency of the FP&A, 63% of them do it based on forecast accuracy and 59% - based on budget accuracy.
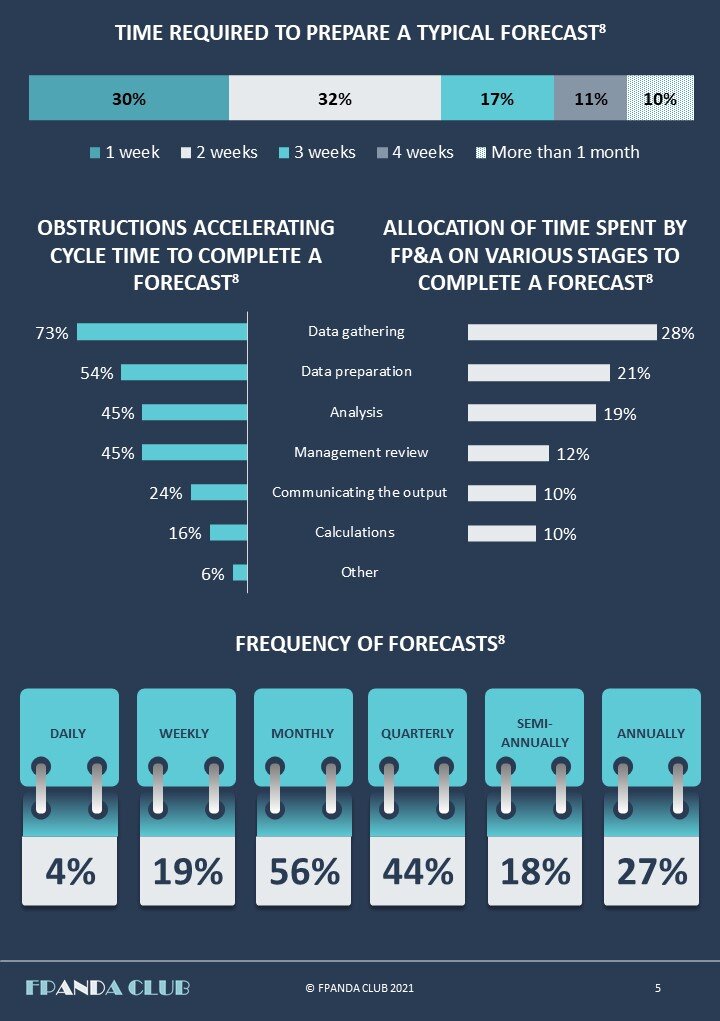
Only 25% of FP&A teams’ time is devoted to value-added analysis.
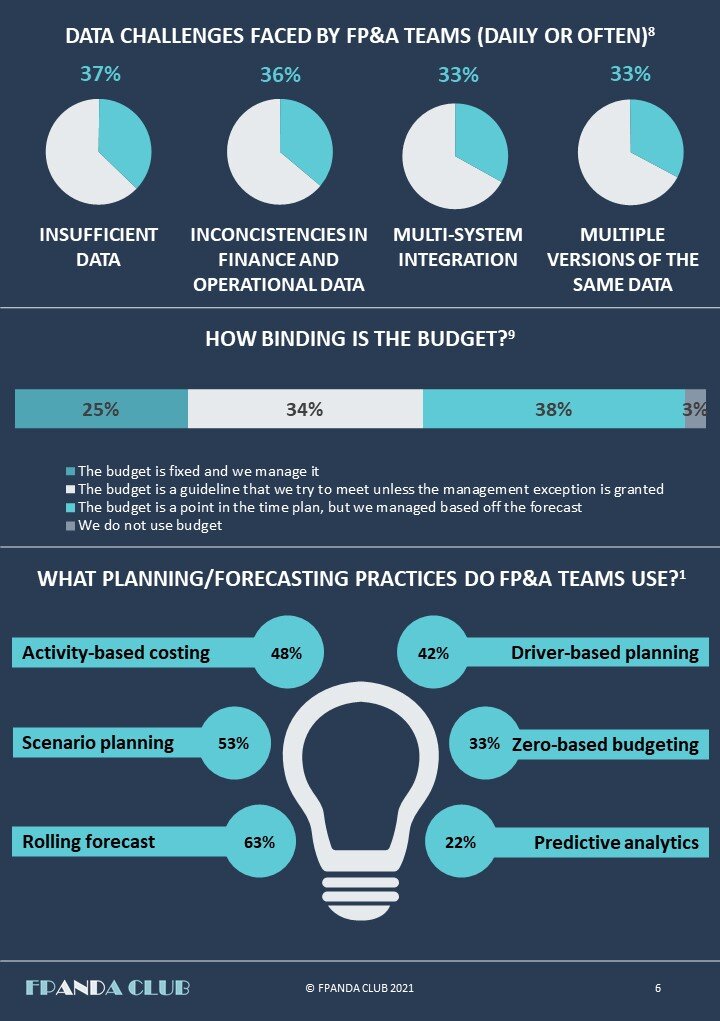
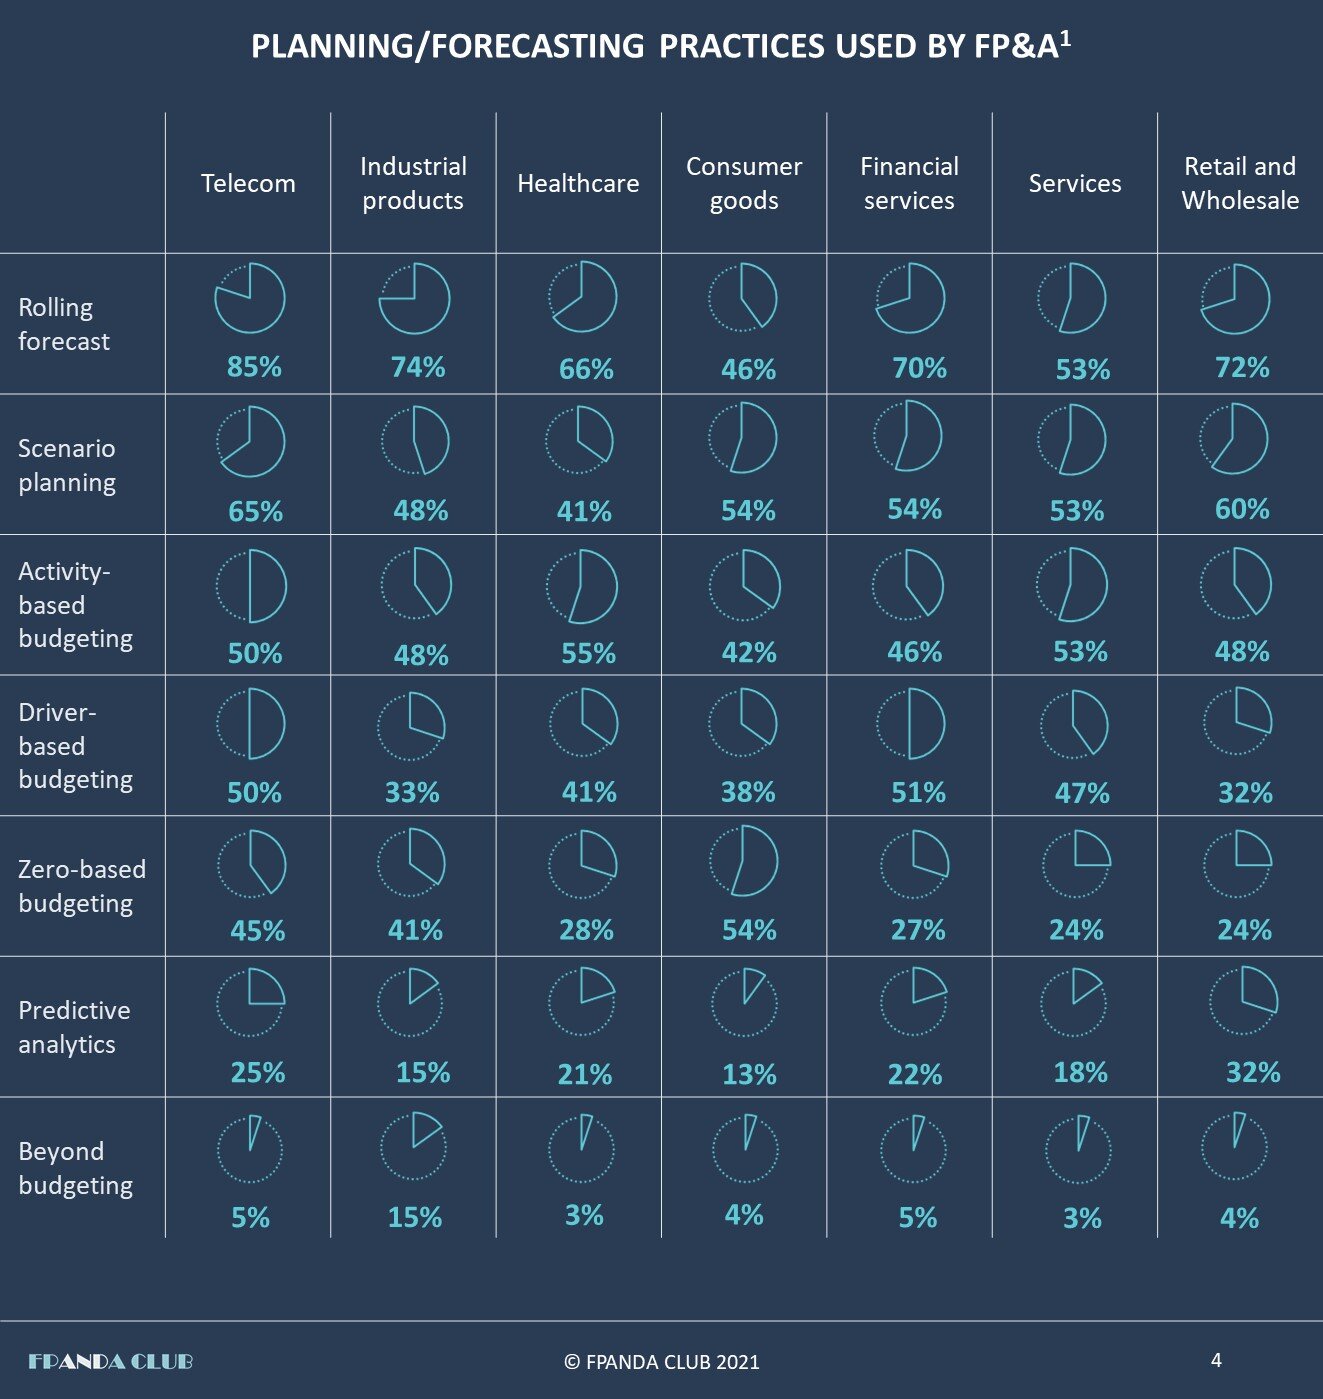
Rolling forecast and scenario planning are among the favorite techniques used by 63% and 53% of FP&A teams correspondingly.
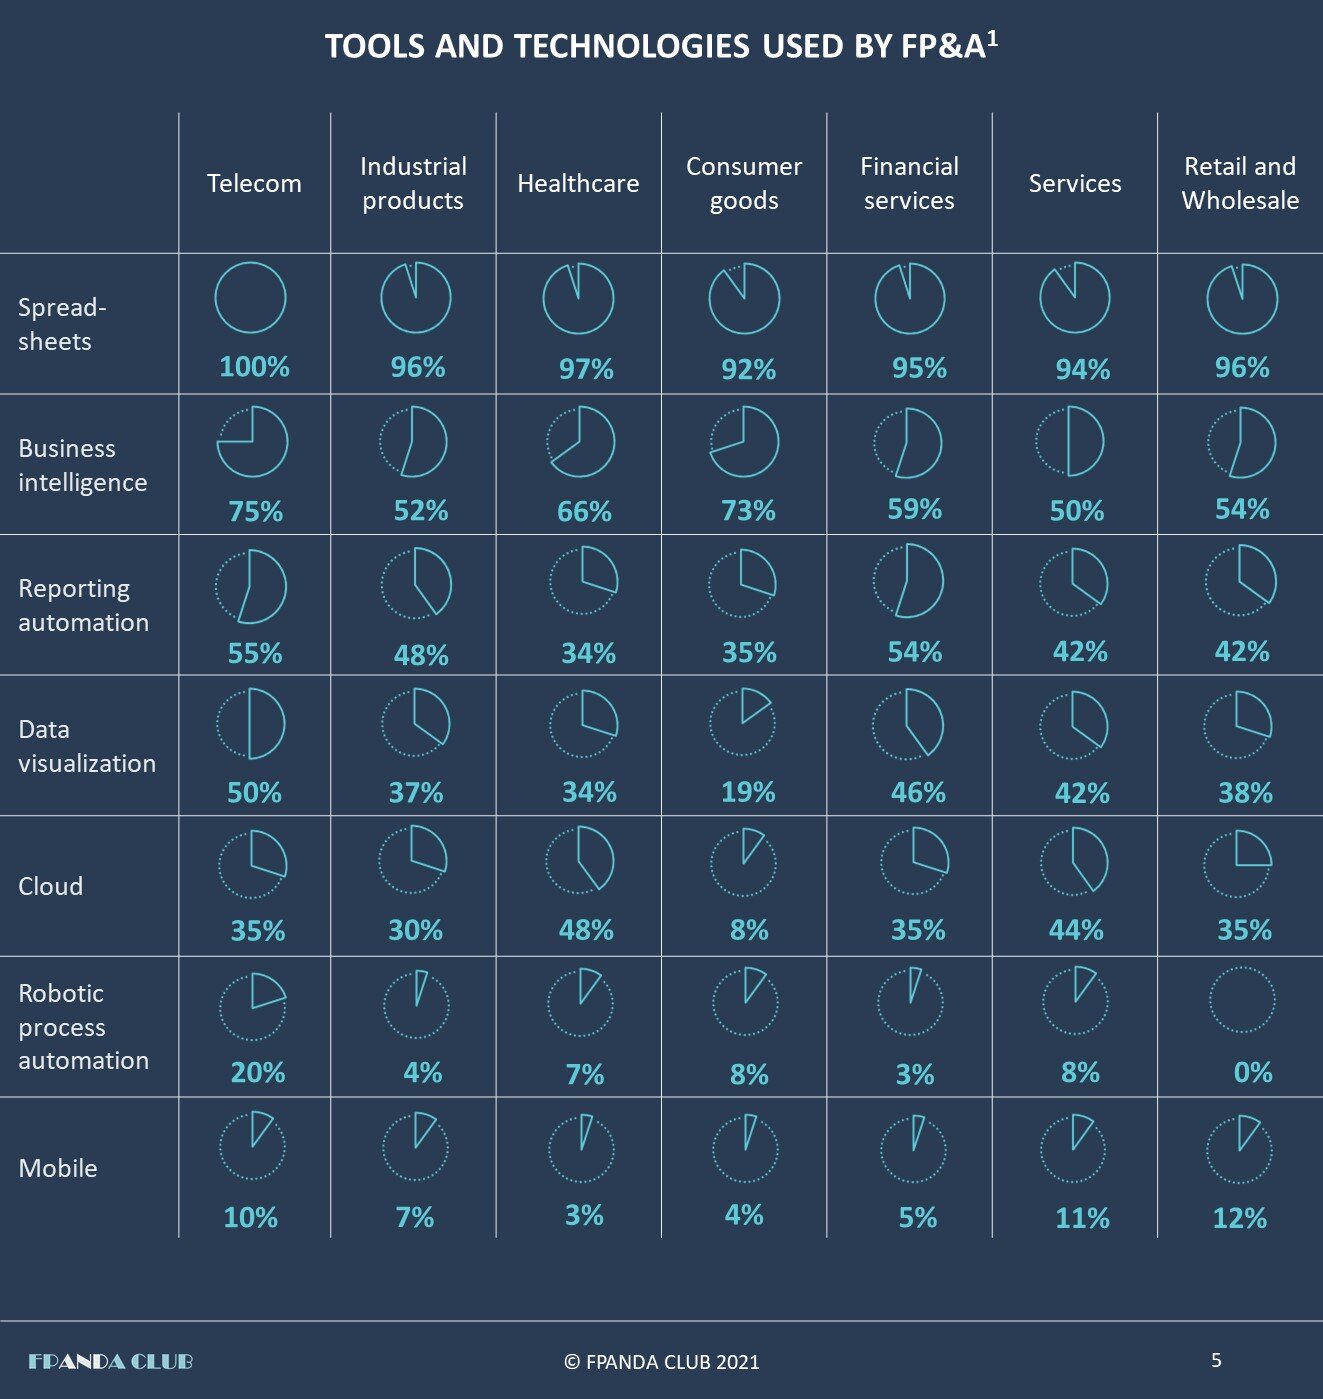
Tools and systems
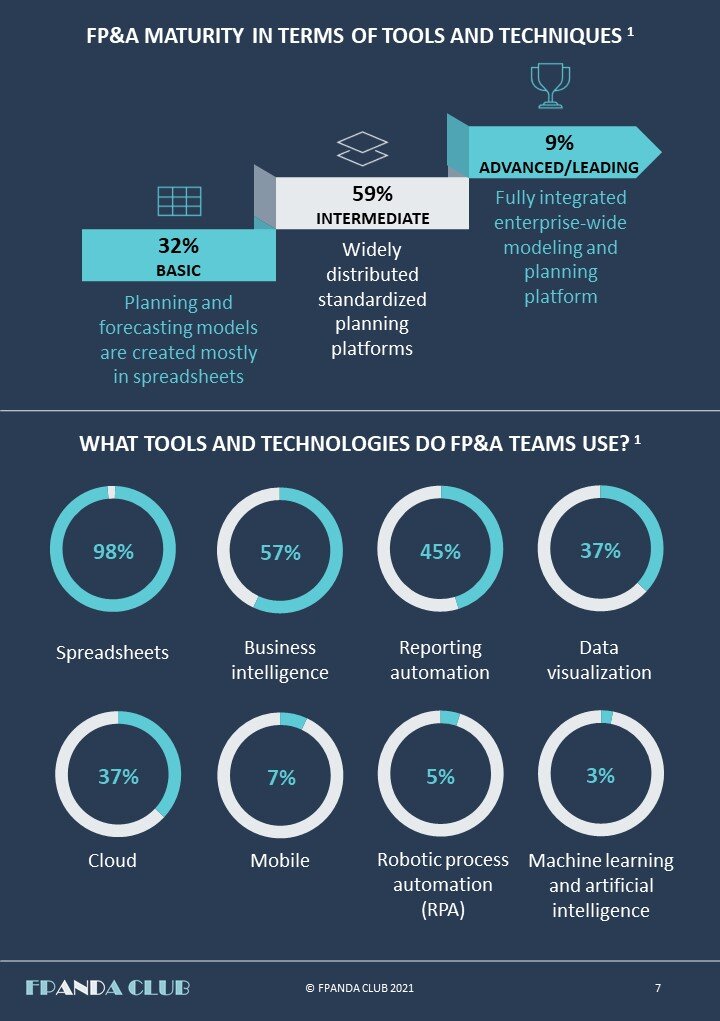
Spreadsheets remain the leading tool used by 98% of FP&A practitioners, BI is falling behind with 57% while less than 5% of FP&A teams are familiar with RPA and AI.
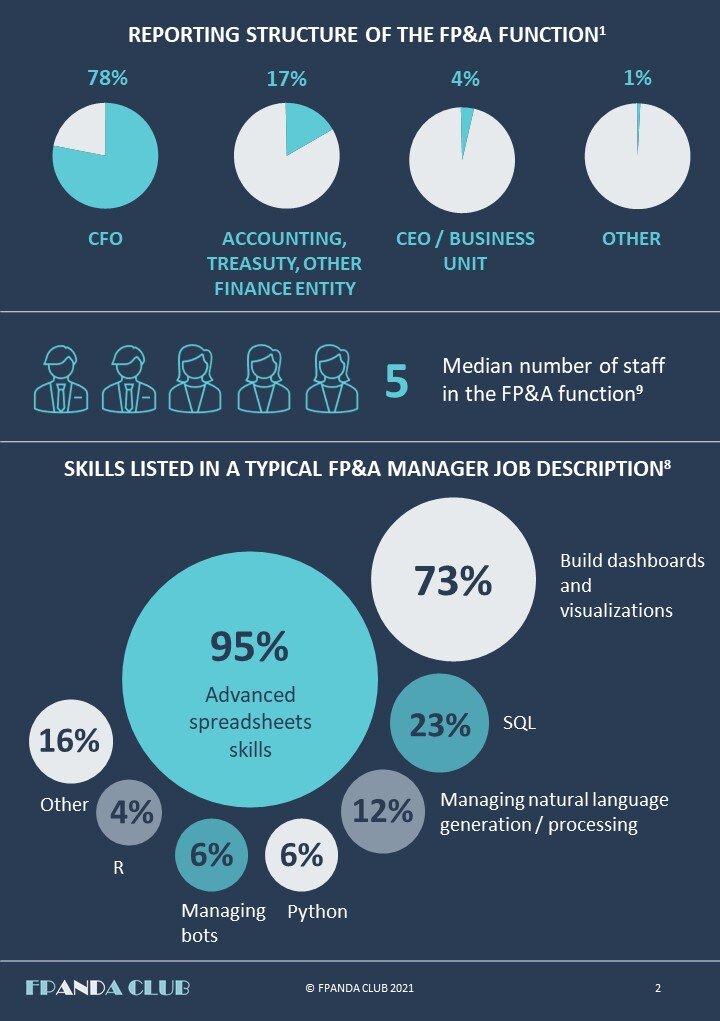
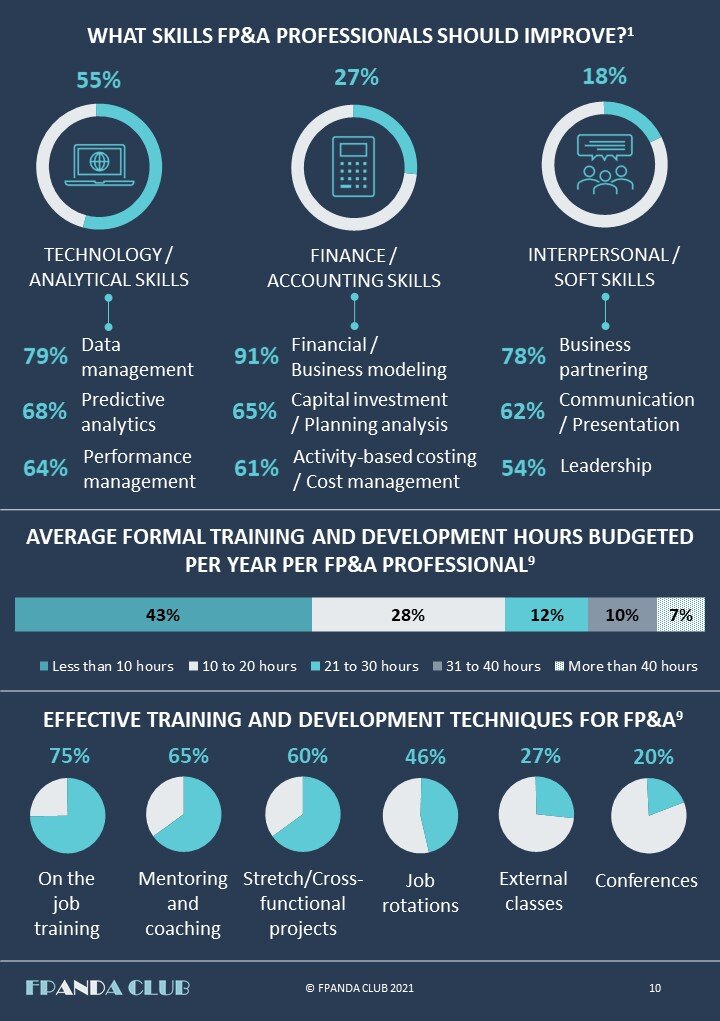
People
FP&A team in general is not numerous with a median number of staff equaling to 5.
Among the skills of FP&A Manager the most wanted are: advanced spreadsheet use and visualization skills mentioned in 95% and 73% of job offers respectively.
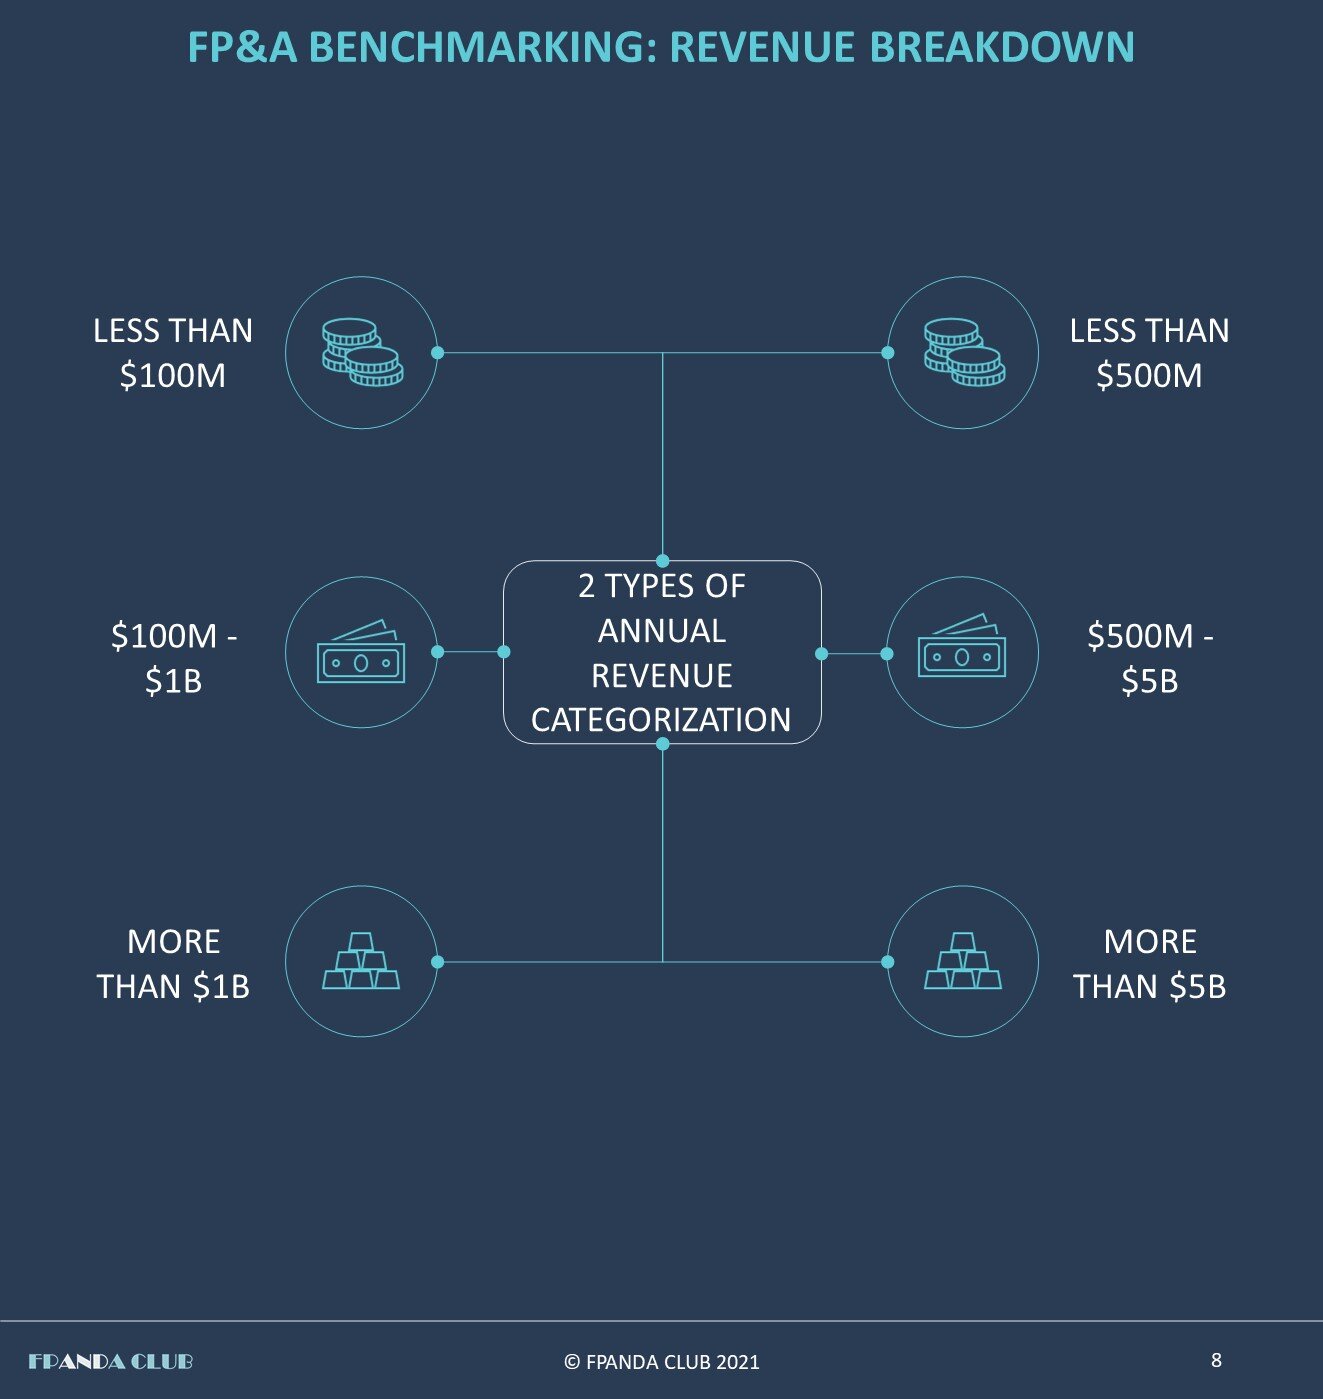
Though it is helpful to see where your FP&A function is standing compared to overall median metrics, it is even more valuable to compare yourself to industry peers. This can be done with the use of the following infographics illustrating the FP&A metrics breakdown by industry and revenue.
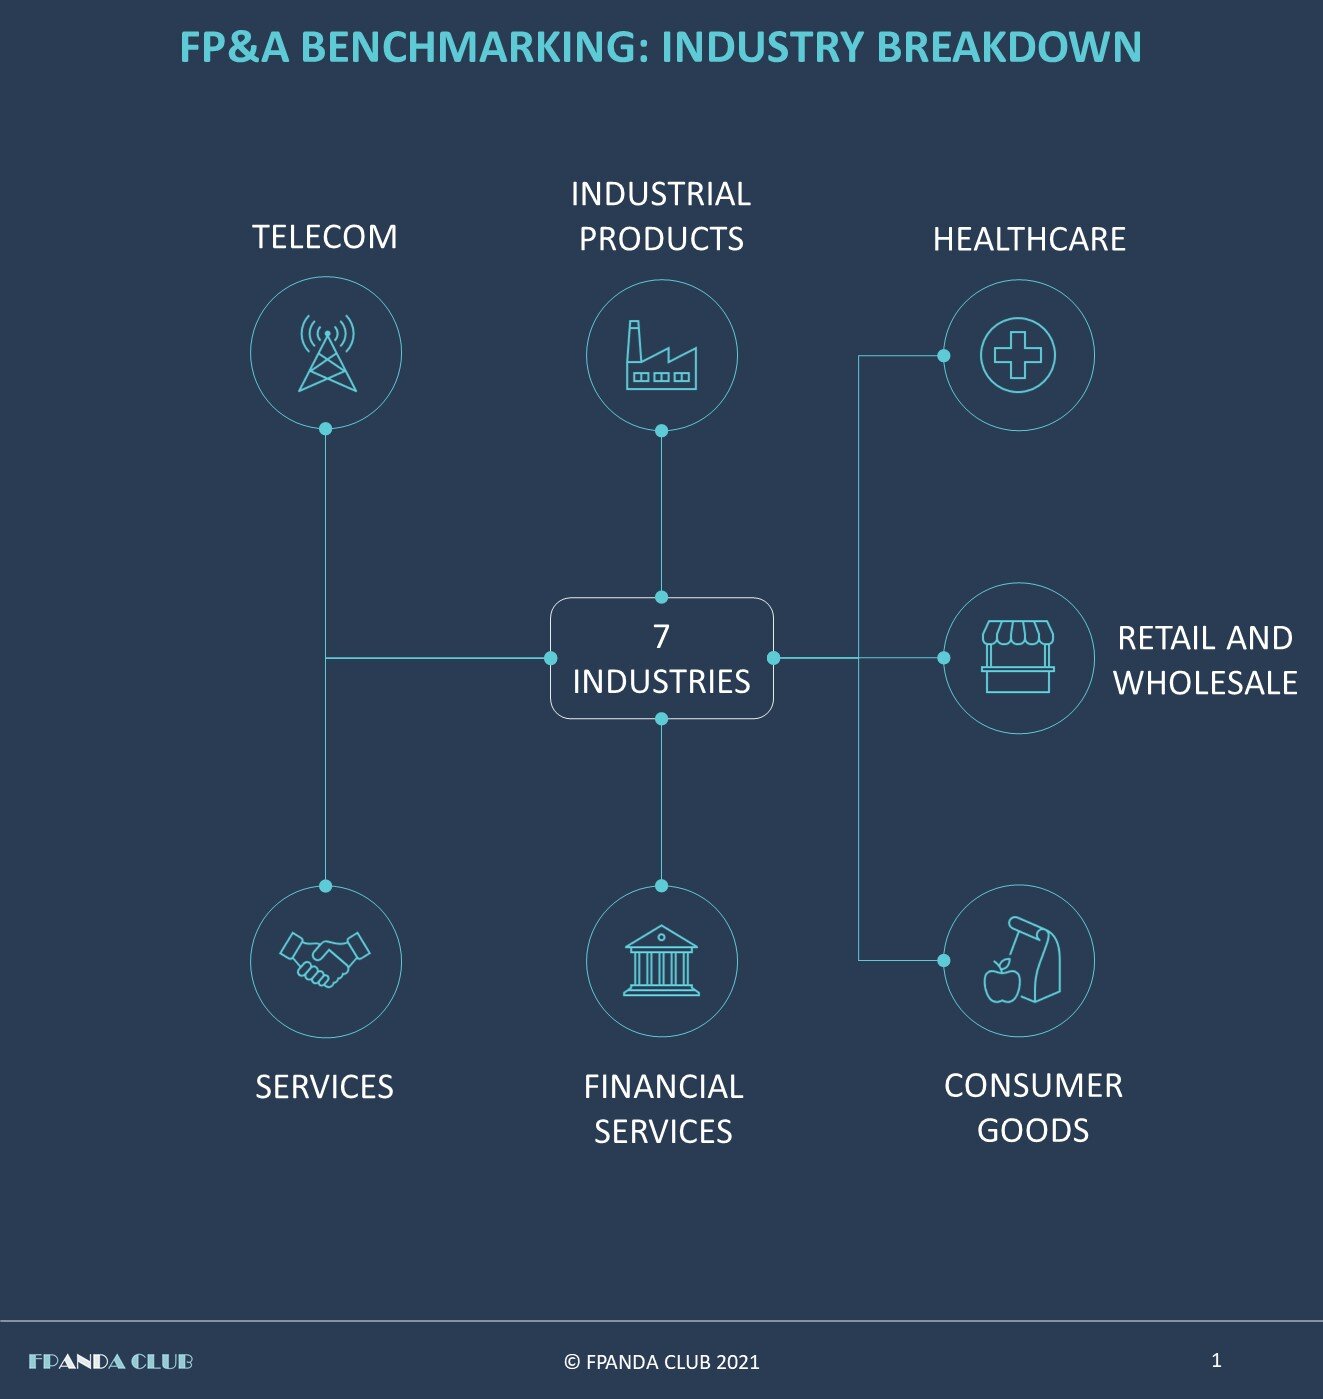


The most interesting findings in industry FP&A benchmarks include:
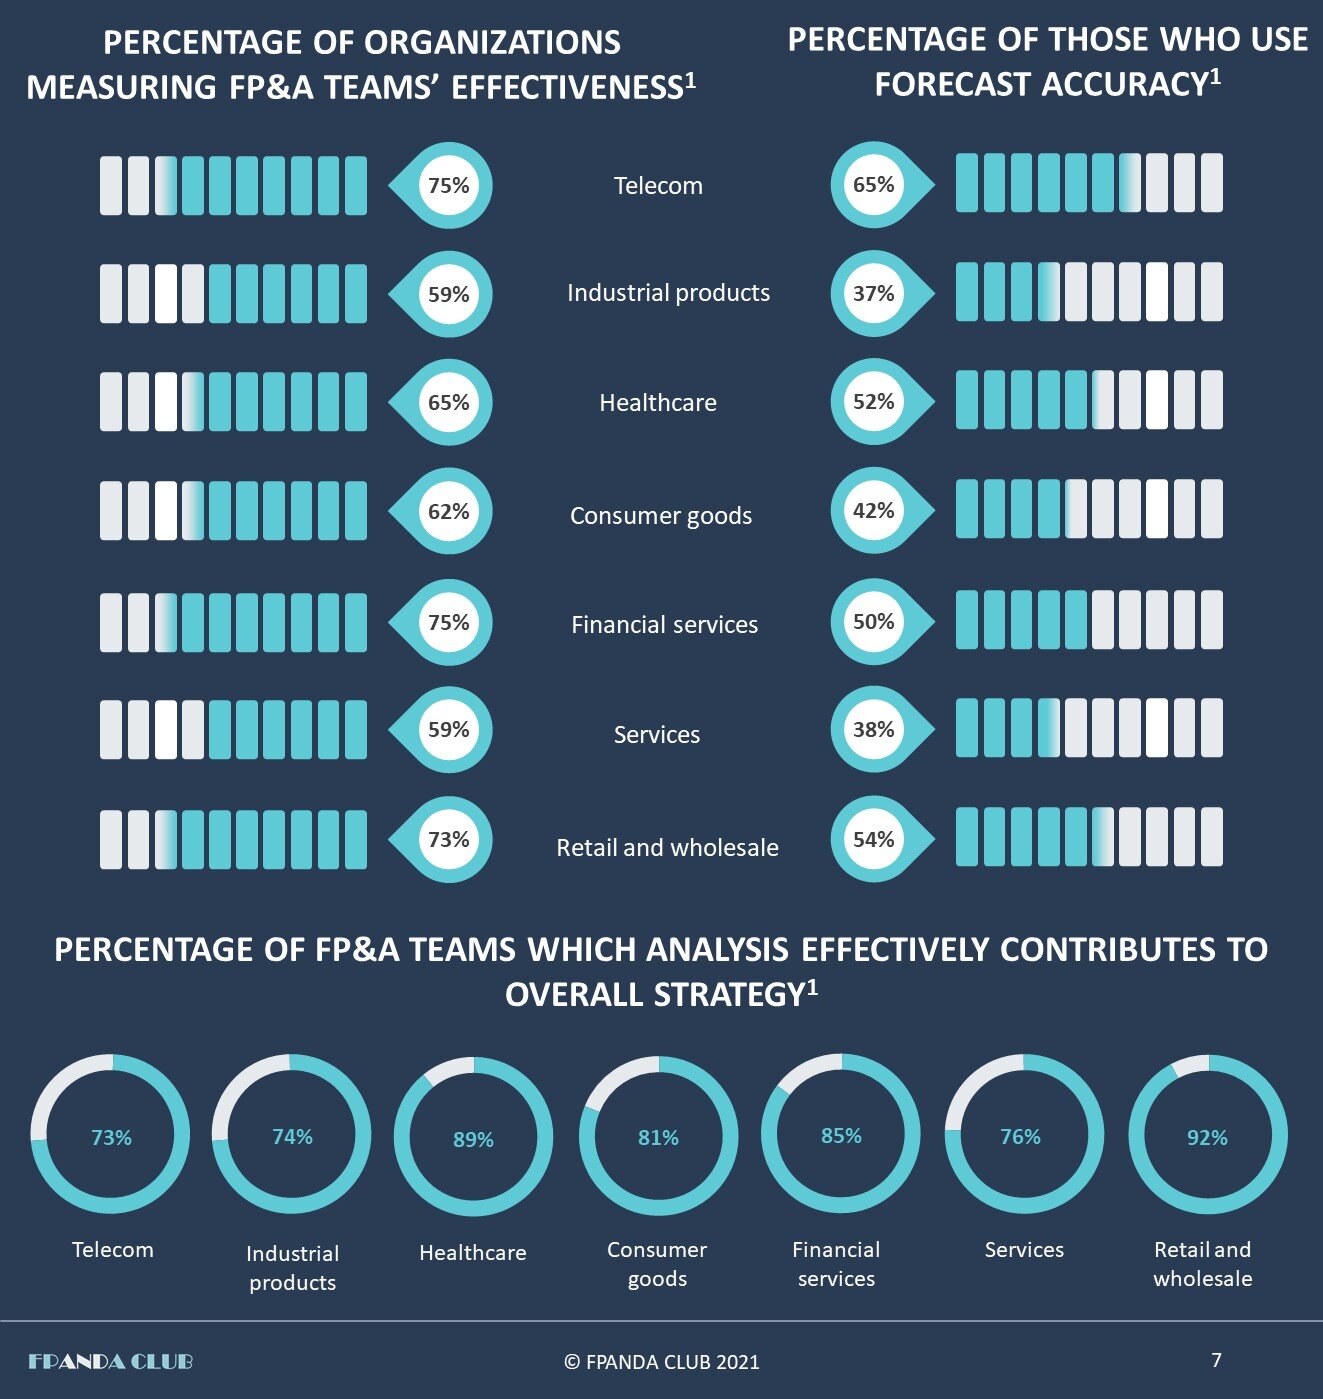
Processes
In ‘retail and wholesale’, healthcare and financial services FP&A provide analysis which effectively contributes to overall strategy in 92%, 89% and 85% of FP&A teams respectively.
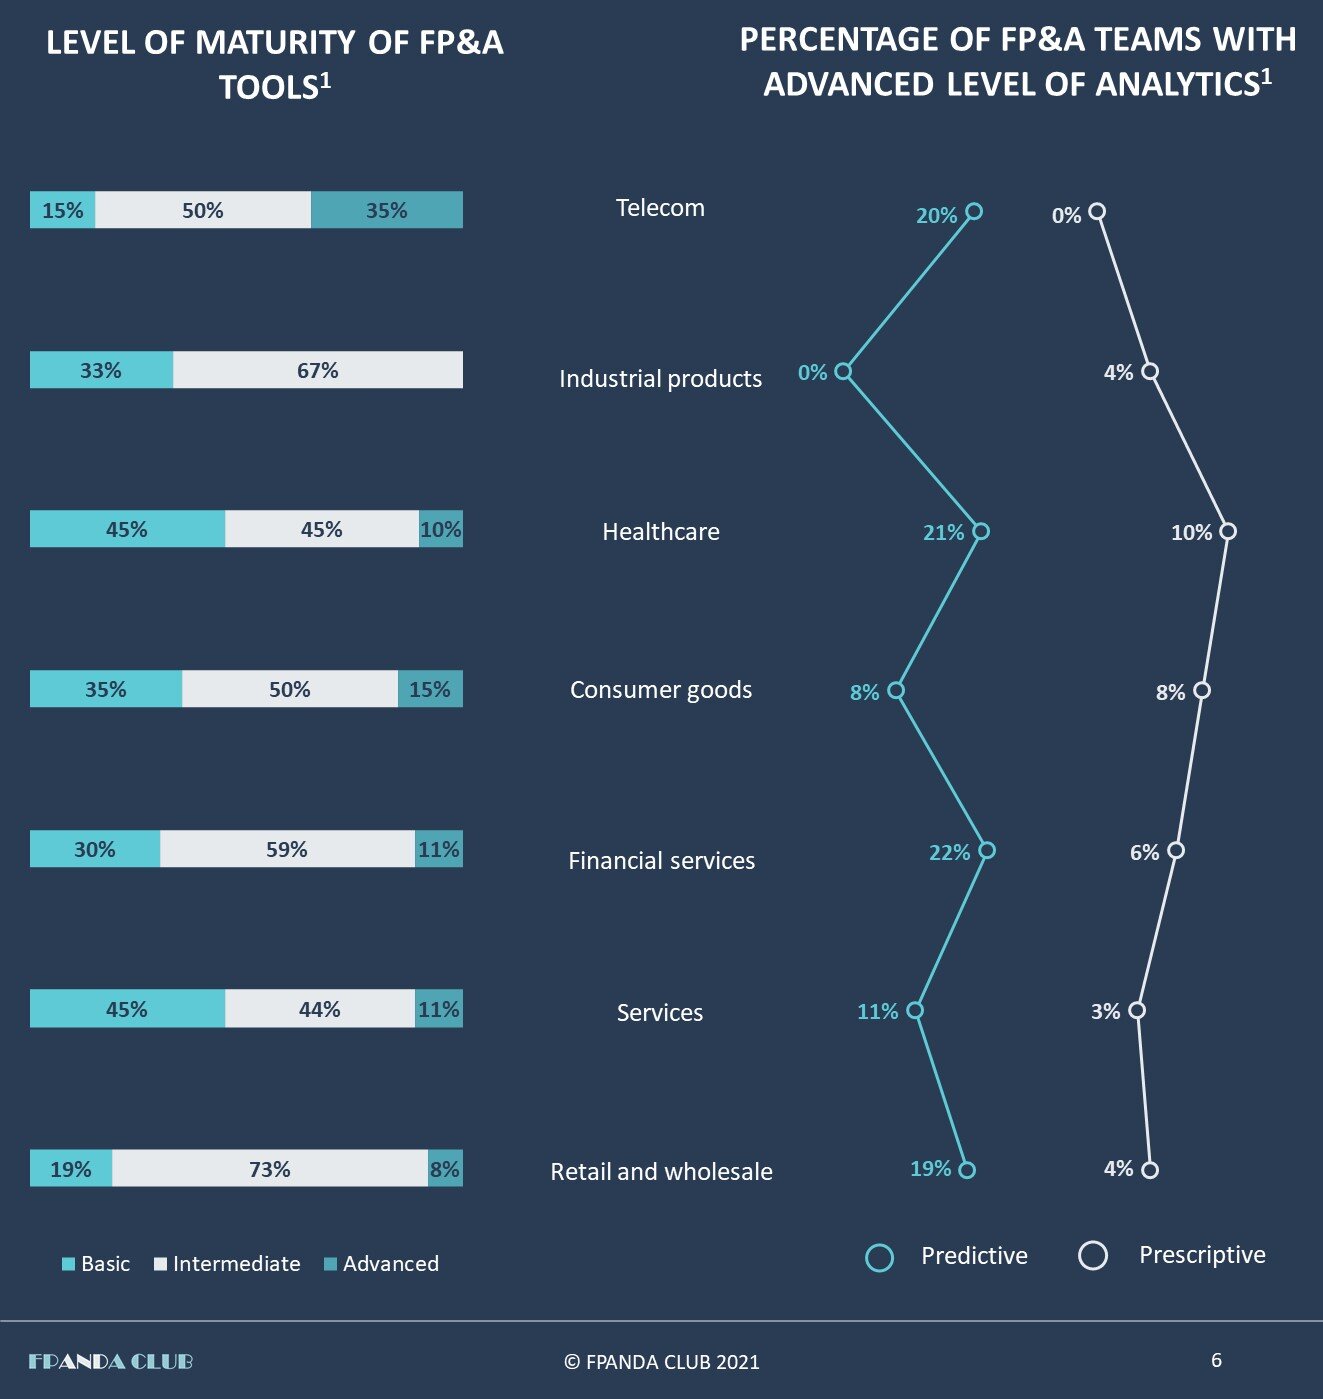
Tools and systems
Telecom and ‘retail and wholesale’ industries are leading in terms of the maturity level of FP&A tools with correspondingly 85% and 81% of organizations with intermediate or advanced tools.
People
The most numerous FP&A teams belong to consumer goods and healthcare industries with median number of staff equaling to 8 people.
Transforming or creating the FP&A organization is a real challenge. Shaping and communicating the vision, defining the main objectives of FP&A and aligning them with the company’s strategy, building the culture of business partnership and advisory, process optimization and leveraging technologies are among the most difficult tasks finance and FP&A leaders face. In this situation testing financial planning and analysis practices against the peers can help a lot, provide valuable insights and shed some light on the possible directions of development in terms of processes, tools and talent acquisition.