This site uses cookies to improve your experience. To help us insure we adhere to various privacy regulations, please select your country/region of residence. If you do not select a country, we will assume you are from the United States. Select your Cookie Settings or view our Privacy Policy and Terms of Use.
Cookie Settings
Cookies and similar technologies are used on this website for proper function of the website, for tracking performance analytics and for marketing purposes. We and some of our third-party providers may use cookie data for various purposes. Please review the cookie settings below and choose your preference.
Used for the proper function of the website
Used for monitoring website traffic and interactions
Cookie Settings
Cookies and similar technologies are used on this website for proper function of the website, for tracking performance analytics and for marketing purposes. We and some of our third-party providers may use cookie data for various purposes. Please review the cookie settings below and choose your preference.
Strictly Necessary: Used for the proper function of the website
Performance/Analytics: Used for monitoring website traffic and interactions
In this post, I will focus on how companies around the world, and in different sectors, performed on their end game of delivering profits, by first focusing on profitability differences across businesses, then converting profitability into returns, and comparing these returns to the hurdlerates that I talked about in my last data update post.
By providing immediate cash flow, SCF helps suppliers avoid the pitfalls of traditional loans that can be challenging to secure during economic downturns. It also boosts adaptability and maintains stability in challenging markets. Additionally, SCF makes cash flow more predictable, aiding in better emergency planning.
The cost of debt is lower than the cost of equity : If you review my sixth data update on hurdlerates , and go through my cost of capital calculation, there is one inescapable conclusion. At every level of debt, the cost of equity is generally much higher than the cost of debt for a simple reason.
That said, about 31% of the net profits of all publicly traded firms listed globally in 2021 were generated by financial service firms; that percent is lower in the US and higher in emerging markets. IFRS and GAAP now treat as leases as debt, but that is still not the case in many other markets that are not covered by either standard).
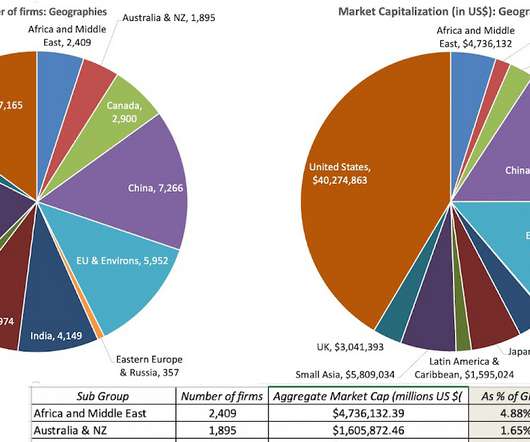
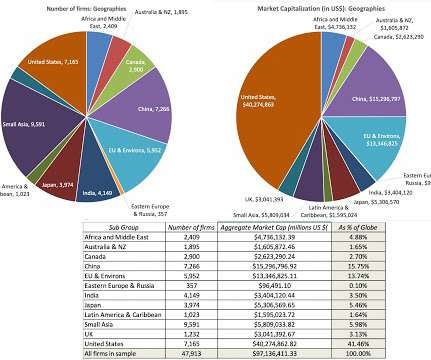
Counter made-up numbers : It remains true that people (analysts, market experts, politicians) often make assertions based upon either incomplete or flawed data, or no data at all. Data universe : In my sample, I include all publicly traded firms with market capitalizations that exceed zero, traded anywhere in the world.
In the first few weeks of 2022, we have had repeated reminders from the market that risk never goes away for good, even in the most buoyant markets, and that when it returns, investors still seem to be surprised that it is there.
In the first few weeks of 2022, we have had repeated reminders from the market that risk never goes away for good, even in the most buoyant markets, and that when it returns, investors still seem to be surprised that it is there.
That said, about 31% of the net profits of all publicly traded firms listed globally in 2021 were generated by financial service firms; that percent is lower in the US and higher in emerging markets. IFRS and GAAP now treat as leases as debt, but that is still not the case in many other markets that are not covered by either standard).
As the risk-free rate rises, expected returns on equities will be pushed up, and holding all else constant, stock prices will go down., and the reverse will occur, when risk-free rates drop. Ultimately, a government that chooses to default is making a political choice, as much as it is an economic one.
The second is to look at the industry group or sector that a company is in, and then follow up by classifying that industry group or sector into high or low growth; for the last four decades, in US equity markets, tech has been viewed as growth and utilities as mature.
Investors are constantly in search of a single metric that will tell them whether a market is under or over valued, and consequently whether they should buying or selling holdings in that market. Risk premiums can and will change over time : Risk premiums are driven by risk aversion, and risk aversion itself can change over time.
Counter made-up numbers : It remains true that people (analysts, market experts, politicians) often make assertions based upon either incomplete or flawed data, or no data at all. Data universe : In my sample, I include all publicly traded firms with market capitalizations that exceed zero, traded anywhere in the world.
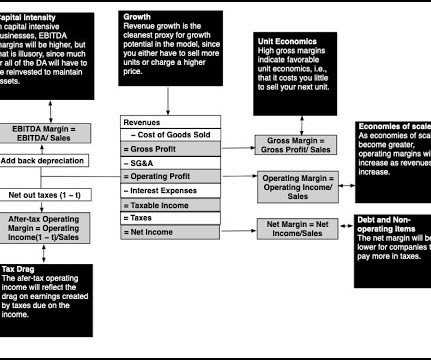
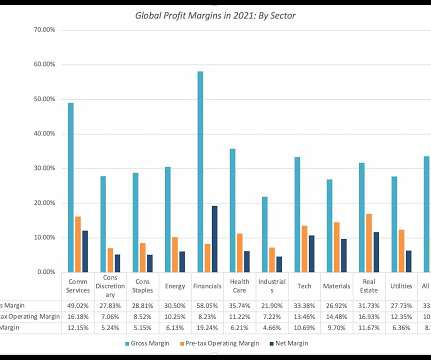
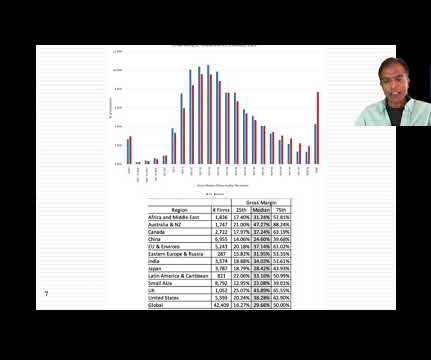
Some of that variation can be attributed to different mixes of businesses in different regions, since unit economics will result in higher gross margins for technology companies and commodity companies, in years when commodity prices are high, and lower gross margins for heavy manufacturing and retail businesses.
I take the point of view that uncertainty should not stop you from valuing companies, that your value estimates will have more error in them, but since the market also faces the same uncertainty, your best bargains may be in the midst of uncertainty. That tells me three things.
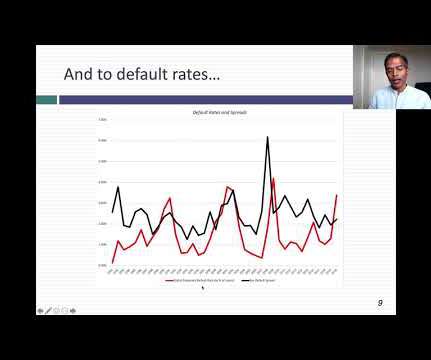
In my last post , I described the wild ride that the price of risk took in 2020, with equity risk premiums and default spreads initially sky rocketing, as the virus led to global economic shutdowns, and then just as abruptly dropping back to pre-crisis levels over the course of the year. against developed market currencies.
I spent the first week of 2021 in the same way that I have spent the first week of every year since 1995, collecting data on publicly traded companies and analyzing how they navigated the cross currents of the prior year, both in operating and market value terms.
In my last data updates for this year, I looked first at how equity markets rebounded in 2023 , driven by a stronger-than-expected economy and inflation coming down, and then at how interest rates mirrored this rebound.
In the second, Warren Buffet used some heated language to describe those who opposed buybacks, calling them “economic illiterates” and “silver tongued demagogues “. Among the emerging market regions, Latin America has the highest percent of cash returned in buybacks, at 26.90%, and India and China are still nascent markets for buybacks.
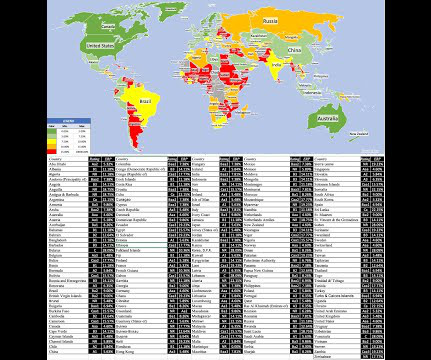
One is curiosity , as political and economic crises roll through regions of the world, roiling long-held beliefs about safe and risky countries. Sovereign Ratings The most widely used measures of sovereign default risk come from a familiar source for default risk measures, the ratings agencies.
directly via email: Resources Featured In This Episode: Looking for sample client service calendars, marketing plans, and more? Because the economics of profitability start showing up particularly when you’re starting to hire other advisors and staff and team. Check out our FAS resource page ! Cean: Thanks, Michael.
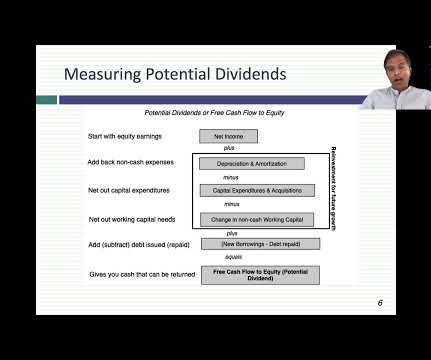
Note that this framework applies for all businesses, from the smallest, privately owned businesses, where debt takes the form of bank loans and even credit card borrowing and equity is owner savings, the largest publicly traded companies, where debt can be in the form of corporate bonds and equity is shares held by public market investors.
CHANCELLOR: And look — yeah, but then if you look at the valuation of the market at that time, the market was — the U.S. CHANCELLOR: And look — yeah, but then if you look at the valuation of the market at that time, the market was — the U.S. RITHOLTZ: That’s how you know it’s going to be low?
After the 2008 market crisis, I resolved that I would be far more organized in my assessments and updating of equity risk premiums, in the United States and abroad, as I looked at the damage that can be inflicted on intrinsic value by significant shifts in risk premiums, i.e., my definition of a crisis.
It’s because, you know, when everybody’s looking at all this data and it all seems terrible, chances are that information’s priced into the market. I 00:13:35 [Speaker Changed] Met him at a, a, a Market Technician’s Association. About equity markets. Oh, nice event. 00:13:46 [Speaker Changed] Yes.
You work at Capital Growth Financial and in former global markets before you join investing Giant Merrill Lynch in 2007, what was that transition like from smaller shops to a really, really big one? You go on the road, you see offices, they ask you questions about markets, stocks, things like that. That’s right.
He, he does some really, really interesting research and gets deep into the weeds on things like market structure, liquidity cascades, what really drives returns, how much should you be focused on alpha versus beta. And I, and I really like the application of math and statistics and computer science to markets. It’s just a model.
We organize all of the trending information in your field so you don't have to. Join 39,000+ users and stay up to date on the latest articles your peers are reading.
You know about us, now we want to get to know you!
Let's personalize your content
Let's get even more personalized
We recognize your account from another site in our network, please click 'Send Email' below to continue with verifying your account and setting a password.


Let's personalize your content