Remove Financial Analysis Remove Forecasting Remove Numbers Remove Profit and Loss
article thumbnail

To NPV or Not to NPV: That Is the Question

Fpanda Club

They tend to avoid losses and prefer to keep the things as they are rather than invest in risky innovation. Analysts usually build their financial models for the first 5 years of the investment and then add terminal value for all the years coming thereafter which may contribute up to 50% of NPV.

article thumbnail

Jedox platform release 2022.3 introduces new visualizations and planning assistance

Jedox Finance

These are commonly used in financial analysis to display how a net value is arrived at through time with gains and losses, or between actual and budgeted amounts. For example, you can use an attribute value in a list to refer to a previous year to show actuals from the previous year compared with the forecasted period (e.g.

Insiders

Sign Up for our Newsletter

This site is protected by reCAPTCHA and the Google Privacy Policy and Terms of Service apply.

Trending Sources

article thumbnail

A Cost Benefit Analysis of Work from Home

CFO Share

Don’t get me wrong – employee satisfaction definitely affects profits. My finance team performed a rigorous cost benefit analysis of working from home and hybrid work versus our baseline of 100% working from office. Productivity is the net of all efficiency gains and losses. Slower delivery due to difficulty collaborating.

article thumbnail

Data Update 1 for 2021: A (Data) Look Back at a Most Forgettable Year (2020)!

Musings on Markets

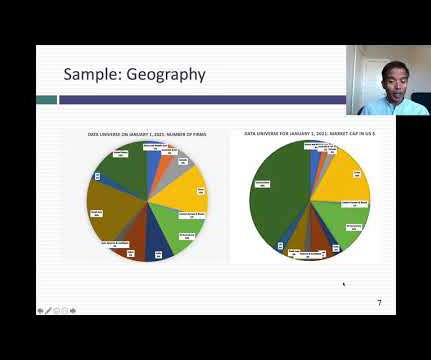
In closing, I also want to dispense with the notion that data is objective and that numbers-focused people have no bias. Finally, it is worth noting that, notwithstanding the travails of last year, the number of firms in the data universe increased from 44,394 firms at the start of 2020 to 46,579 firms, a 4.9%

article thumbnail

The Best Power BI Visuals for Financial Reporting

Collectiv

The most valuable indicators of the financial health and position of an organization are the metrics that are tracked in financial statements—Balance Sheets, Profit and Loss Statements, Cash Flow Statements, Account Receivables, and more. And if you’re talking about profitability, that difference is huge.

article thumbnail

In Search of Safe Havens: The Trust Deficit and Risk-free Investments!

Musings on Markets

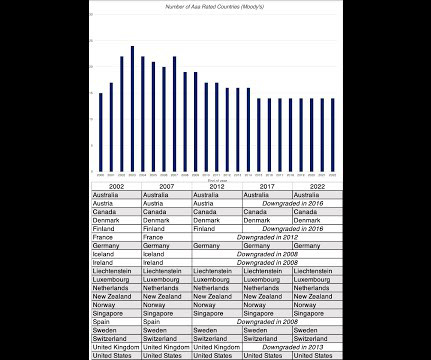
If you do assume that markets will price away this excess profit, you then have the basis for the models that are used to value options and other derivative assets. That is why the risk-free rate becomes an input into option pricing and forward pricing models , and its absence leaves a vacuum.